WhoDB
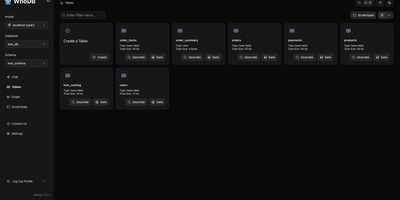
With nearly 5,000 GitHub stars earned in under two years, WhoDB has rapidly emerged as the lightweight alternative to heavyweight database clients like DBeaver and DataGrip by delivering a sub-50MB binary that starts in under a second and connects to 18+ database systems from a single interface. The Go backend serves the React and TypeScript frontend with table virtualization for efficient rendering of large result sets, lazy loading, and query result streaming that keeps the interface responsive even when browsing tables with millions of rows. The Community Edition connects to PostgreSQL, CockroachDB, YugabyteDB, MySQL, MariaDB, TiDB, SQLite, DuckDB, MongoDB, FerretDB, Redis, Valkey, Dragonfly, Elasticsearch, OpenSearch, ClickHouse, QuestDB, and Memcached through a unified credential selector that switches between databases with minimal configuration. Interactive schema diagrams render entity-relationship graphs showing table structures, foreign keys, and column types for visual database exploration. The Jupyter-style query scratchpad provides SQL autocomplete, syntax highlighting, and multi-statement execution with paginated results. AI integration optionally connects to Ollama, OpenAI, Anthropic, LM Studio, or any OpenAI-compatible provider for natural language database queries — ask questions in plain English and receive generated SQL. Data management includes inline row editing, CSV export, and filtered data views. Docker deployment runs a single container exposing port 8080. Running on a dedicated VPS on RepoCloud with guaranteed CPU, RAM, and SSD, full root SSH access, and a browser serial console. Apache-2.0 licensed.
D-Tale
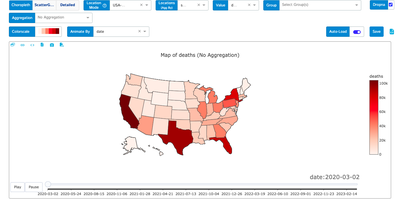
If your data lives in a pandas DataFrame, D-Tale gives it a spreadsheet-style grid, a column profiler, and a chart builder in the browser, started with one call from a notebook or script. In the grid you sort, filter, and edit cells inline, lock, hide, reorder, rename, or reformat columns from their menus, and open a Describe view with each column's distribution, summary statistics, outliers, and missing values, while highlight modes color dtypes, outliers, and numeric ranges across the whole table. Correlation matrices, a predictive power score, and duplicate reports sit beside dataframe functions that add numeric, binned, date, random, and type-converted columns, and Merge & Stack combines dataframes, including ones uploaded from Excel files. The chart builder draws line, bar, stacked, pie, wordcloud, heatmap, 3D scatter, surface, and map charts with grouping and aggregation, exports them as standalone HTML, and a network viewer graphs relationships between nodes. Whatever you build in the interface can be exported as reproducible Python code, and data can be saved as CSV or TSV. Launch it from Jupyter, Google Colab, Kaggle, a terminal, or the command line with a CSV path, protect it with optional authentication, and choose light or dark themes and English or Chinese. Running on a dedicated VPS on RepoCloud with guaranteed CPU, RAM, and SSD, full root SSH access, and a browser serial console. LGPL-2.1 licensed.
DAC
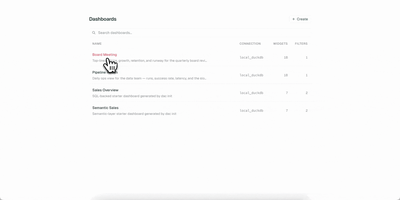
Your dashboards deserve version control, code review, and reproducible builds, just like the rest of your stack. DAC lets you define interactive data dashboards in YAML or TSX, validate them in CI, and serve them from a single Go binary that embeds a full React frontend. Choose from 21 chart types including line, bar, area, pie, scatter, bubble, funnel, sankey, heatmap, calendar, sparkline, waterfall, gauge, treemap, radar, and candlestick, plus metric cards, data tables, text blocks, and image widgets. The built-in semantic layer lets you define metrics and dimensions once in reusable model files, then reference them from any widget while DAC generates the SQL automatically. Connect to Postgres, MySQL, Snowflake, BigQuery, Redshift, Databricks, and DuckDB through standard Bruin connection configs. Interactive filters with date pickers, dropdowns, multiselects, and search inputs inject values via Jinja templating and re-execute only affected widgets. Live reload via Server-Sent Events refreshes connected browsers instantly when you save a file. Export dashboards as self-contained static HTML with baked-in query results for S3, GitHub Pages, or offline sharing, and render slide decks via the Google Slides export command. On RepoCloud, deploy DAC on a dedicated VPS with root SSH access and persistent storage for your dashboard definitions and database connections under the AGPL-3.0 license.
Latent Scope
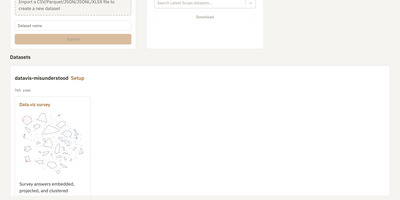
Survey answers, support tickets, and documents become an interactive map where similar rows sit together, so patterns show up before anyone reads a single row. Latent Scope imports a CSV, Parquet, JSON, JSONL, or XLSX file in the browser, then walks through five setup steps: embed the text with a local or hosted model, project the vectors to two dimensions, cluster the points, label every cluster, and publish the result as a scope. The Explore view pairs a searchable table with the map, so you can type a phrase to run a nearest-neighbor search, browse cluster lists, and open any row's full text. Setup keeps every experiment in a gallery with thumbnails and quality scores, which makes comparing parameters painless. Image collections get a zoomable image map, and ColBERT multi-vector embeddings support late-interaction search. Export tables, or render publication-ready plots with dark mode, glow, and custom fonts. A read-only mode and a Hugging Face downloader help you share finished scopes. Running on a dedicated VPS on RepoCloud with guaranteed CPU, RAM, and SSD, full root SSH access, and a browser serial console. MIT licensed.
Daily Stars Explorer
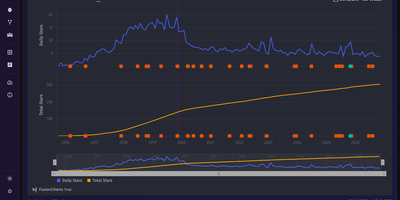
From a one-day Hacker News spike to a decade of steady growth, Daily Stars Explorer charts any GitHub repository's star history day by day, next to the releases and mentions that explain it. Type an owner and repository name, and daily and cumulative stars appear. Range shortcuts: 10Y, 5Y, YTD, QTD, MTD, and All. Zoom with a draggable lower navigator, switch to a Log Y axis, and read the stars gained inside the selected window. Transforms reshape the series. A trend line projects 30 days ahead. Yearly, monthly, or weekly grouping. Peak normalization. LOESS smoothing. Running average and median. First and second derivatives. Weekly growth rate. Feed overlays, enabled by optional provider credentials, mark releases and mentions from Hacker News, Reddit, GitHub, and YouTube right on the curve. Compare two already-fetched repositories on shared axes, with an aggregate selector, Log Y, and optional star milestones, then copy the link. With a GitHub token, separate pages chart commits, with the longest gap highlighted on demand, plus pull requests, issues, forks, and contributors. Global activity counts the public repositories or pull requests created on GitHub each day. Featured repos lists Hacker News and Reddit posts that link to GitHub projects, sortable by points, comments, or date. Star history, commit, and activity charts export to CSV or JSON. Favorite repositories can be pinned. Running on a dedicated VPS on RepoCloud with guaranteed CPU, RAM, and SSD, full root SSH access, and a browser serial console. MIT licensed.
Dekart
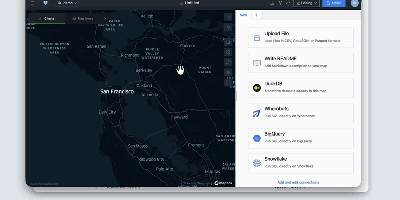
Dekart turns SQL queries against your data warehouse into interactive maps and charts you can share with a link. Connect Postgres, BigQuery, Snowflake, Wherobots, or DuckDB, write a query, and the results render as WebGL map layers that stay responsive even at a million points. Layers stack: put places in one, boundaries in another, add H3 hexagon aggregations where raw points would turn into soup, and tune colors and styles until the pattern you suspected in the table becomes obvious on the map. Interactive charts sit beside the map and move with it, so filtering a distance histogram or a category breakdown updates the geography at the same time. Query parameters let viewers change inputs like radius or date range without touching SQL, which makes one report serve a whole team. Maps share through private links, so a stakeholder opens the live result instead of receiving a stale screenshot in a slide deck. Uploading a CSV, GeoJSON, or Parquet file is enough for a quick one-off, and Markdown reports add explanation next to the data. AI agents can join in through the MCP interface to build and refine maps from natural-language requests. Single sign-on through Google OAuth, Keycloak, Cognito, or IAP keeps access governed, and the whole application runs as one Docker container with built-in storage for zero-configuration starts. Running on a dedicated VPS on RepoCloud with guaranteed CPU, RAM, and SSD, full root SSH access, and a browser serial console. AGPL-3.0 licensed.
Apache Superset
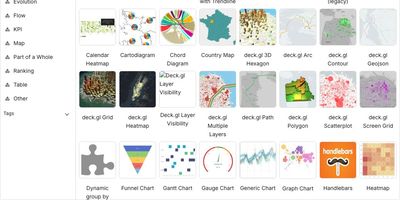
Powering data analytics at companies like Airbnb, Twitter, and Lyft where it originated, Apache Superset has become the leading open-source business intelligence platform with over 65,000 GitHub stars and an Apache Software Foundation top-level project designation. The platform ships with over forty visualization types out of the box including geographic maps, time-series charts, pivot tables, heatmaps, treemaps, and Sankey diagrams, all rendered with Apache ECharts for publication-quality output. Its SQL Lab provides a full-featured IDE experience with syntax highlighting, autocomplete, query history, and result caching for interactive data exploration. Superset connects natively to PostgreSQL, MySQL, ClickHouse, Trino, Presto, BigQuery, Snowflake, Apache Druid, Apache Hive, and dozens more databases through SQLAlchemy connectors, with support for custom database drivers via Python plugins. The semantic layer allows data teams to define calculated columns, metrics, and virtual datasets that business users can query without writing SQL. Role-based access control with row-level security enables fine-grained data governance, while the embedded analytics SDK lets you integrate dashboards directly into external applications via iframes with SSO pass-through. The caching layer supports Redis and Memcached for query result caching, and the asynchronous query execution engine powered by Celery handles long-running queries without blocking the UI. Alerts and reports can be scheduled via email or Slack with PNG or CSV attachments generated from any chart or dashboard. Running on a dedicated VPS on RepoCloud with guaranteed CPU, RAM, and SSD, full root SSH access, and a browser serial console. Apache 2.0 licensed.
Velocity
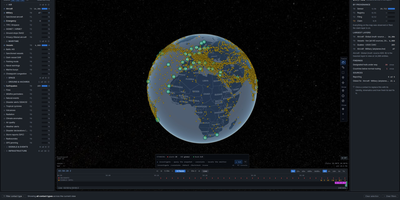
Velocity watches aircraft, ships, and satellites move across a live map and records everything it sees, so you can rewind the world to any moment you captured instead of begging commercial trackers for history. Thousands of contacts move across the globe in real time with no account and no API keys, and clicking any aircraft or vessel opens its dossier: identity, kinematics, route, track history, and a note on which feeds reported the position and how fresh it is. A scrubber along the bottom replays the last hour or the last week at up to 3600x speed, turning yesterday's near-miss or dark vessel into something you can actually inspect. Layers add GPS jamming, ships with AIS switched off, flight restrictions, earthquakes, military bases, ports, and maritime chokepoints such as Hormuz and Malacca with live transit counts. An autonomous watch officer ranks spoofing, jamming, and dark-vessel alerts into an inbox and writes cited incident briefs, while anything worth keeping drops into an evidence locker with hash-verified custody records exportable as reports. Running on a dedicated VPS on RepoCloud with guaranteed CPU, RAM, and SSD, full root SSH access, and a browser serial console. AGPL-3.0 licensed.
Stock Screener
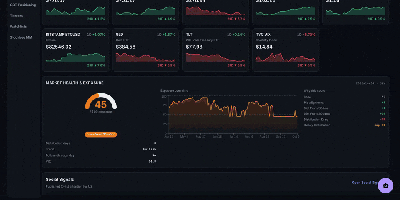
Stock Screener scans twelve global markets every day so growth investors can find CANSLIM and Minervini style candidates without stitching together spreadsheets and charting sites. You run bulk scans with more than eighty technical and fundamental filters, then rank results by composite scores, relative strength sparklines, and multi-screener ratings that show which names pass several methodologies at once. Market health and exposure views translate breadth into position-sizing guidance, while StockBee style breadth pages track daily movers, advance and decline lines, new highs and lows, and benchmark overlays from one shared calculation layer. Industry group rankings order sectors and groups by relative strength with one-week to six-month movers, and the Relative Rotation Graph plots groups moving through leading, weakening, lagging, and improving quadrants. The stock matrix lays out constituents in grid or cluster layouts colored by change or relative strength, watchlists organize into drag-and-drop folders with sparklines, and theme discovery watches news and social feeds for emerging narratives. An AI research chatbot answers questions against the same daily data, an options command center adds gamma and volatility context for top candidates, and backtesting validates published picks against price history. Running on a dedicated VPS on RepoCloud with guaranteed CPU, RAM, and SSD, full root SSH access, and a browser serial console. Apache-2.0 licensed.
Lumen
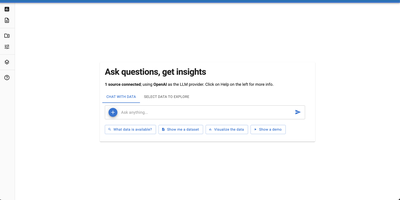
Ask Lumen which islands have the most penguins and it writes the SQL, runs it, and draws the chart in a split-screen explorer. Drag in CSV, Parquet, JSON, or Excel files, or point it at a database, and mark extra files as metadata so the model understands what each column means. Every answer lands in its own exploration, with follow-up questions nested beneath it, and the generated SQL or Vega-Lite chart specification sits in an editor you can change to update the view instantly. Tables sort, filter, and paginate, charts carry tooltips and annotations, and results export as CSV, Excel, PNG, or PDF. Report mode gathers all explorations into one document that downloads as a notebook with every question, query, and visualization ready to rerun. A planner agent breaks hard questions into steps, a validation pass checks that the answer matches the request, and settings choose among OpenAI, Anthropic, Ollama, and other language model providers. Developers can add custom agents, tools, and analyses, or write declarative specifications that become shareable dashboards. Running on a dedicated VPS on RepoCloud with guaranteed CPU, RAM, and SSD, full root SSH access, and a browser serial console. BSD-3-Clause licensed.
Helical Insight
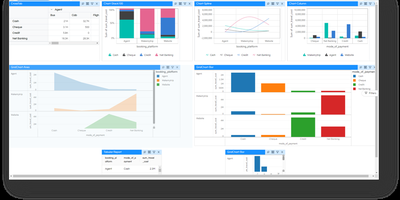
Finance closes the month with invoices that must print perfectly, analysts answer questions from a dashboard, and executives ask the data things in plain language: one platform handles all three jobs. Interactive dashboards support drill-down, drill-through, filters, KPI widgets, maps, and pivot tables, and scheduled delivery or report bursting pushes personalized copies to the people who need them. Pixel-perfect paginated reports cover statements, regulatory documents, and anything where layout is not negotiable. A chat interface generates SQL against connected sources, summarizes reports, and surfaces insights, running against a language model the organization itself chooses. Embedding puts dashboards, reports, and the chatbot inside customer portals and SaaS products, with white labeling swapping logos, themes, colors, and URLs for OEM delivery. Multi-tenancy isolates customers or departments on a single deployment. Row, column, and table level security follows the logged-in user, arriving through JWT, Okta, Keycloak, OAuth, or custom token single sign-on. Exports land in PDF, Excel, CSV, Word, HTML, JSON, and XML. Caching, pagination, virtualization, and clustering keep large deployments responsive, localization adapts the interface for regional teams, custom JavaScript visualizations extend the built-in charts, and REST APIs automate administration across the whole system. Running on a dedicated VPS on RepoCloud with guaranteed CPU, RAM, and SSD, full root SSH access, and a browser serial console. AGPL 3.0 licensed.
uMap
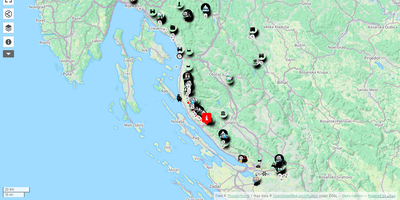
uMap turns OpenStreetMap into a personal mapmaking canvas: draw markers, lines and polygons in the browser, layer your own data over detailed street maps, and embed the finished map in any website. Each map is built from data layers you can style independently, choosing marker shapes, colors, icons and popups that show names, descriptions, photos or videos when clicked. You can sketch points of interest by hand or batch import whole datasets in GeoJSON, GPX, KML or OSM format, then let clustering group dense markers or a heatmap reveal where things concentrate. Backgrounds come from a choice of OpenStreetMap based tile layers, so the same map can sit on a street plan or a cycling map depending on the audience. Finished maps embed with a snippet of HTML, stay interactive inside the page, and can be downloaded or shared by link with read only access for viewers. Permissions decide who owns, edits or only views each map, and with real time collaboration switched on, several editors can draw on the same map simultaneously and watch each other's changes appear live. A slideshow mode turns layers into a guided story, stepping viewers through places in order with text and media attached to each stop. Running on a dedicated VPS on RepoCloud with guaranteed CPU, RAM, and SSD, full root SSH access, and a browser serial console. AGPL-3.0 licensed.
Immich Insights
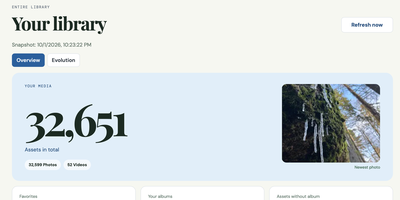
Immich Insights turns the photo library you already keep in Immich into a year-in-review style dashboard of how you actually shoot. Connect it with your own Immich API key and it reads your asset metadata into a local snapshot, without copying your original photos, then builds the overview Immich itself never shows: total photos and videos, storage used, favorites, albums, and your newest additions. Pick any year or a custom date range and see that period's shooting volume, favorites, albums, and devices. Camera statistics break your library down by device and manufacturer, with leaderboards you can correct when the same camera appears under different names. Exposure analysis shows your ISO, focal length, and shutter speed distributions, the focal lengths you reach for most, and how your settings shift by hour of day. Rhythm charts map your shooting by month, weekday, and hour, with a calendar heatmap of your most active days. A zoomable timeline marks the moments that matter: first photo, a new device joining the library, your longest gap, your busiest day ever. People and location views count faces and mapped places by country and continent, and a photography profile scores your habits. Clicking any chart value opens the matching photo thumbnails, and reports export as PDF, CSV, or JPG. Running on a dedicated VPS on RepoCloud with guaranteed CPU, RAM, and SSD, full root SSH access, and a browser serial console. MIT licensed.
Neohabit
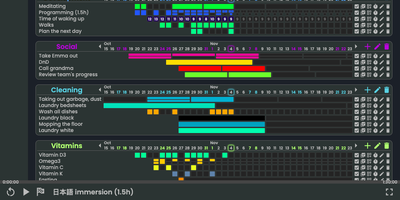
Most habit trackers punish a single missed day, so Neohabit lets you build routines that happen X times in Y days, like three workouts in five days or one deep-work session every three days, and adjust the target mid-streak as the habit gets easier. Your progress renders as GitHub-style contribution heatmaps in three styles: monochromatic grids for simple check-ins, numeric grids that record values such as calories, spending, reps, or hours up to two billion, and fractured grids that split each period into up to sixteen segments for habits done many times a day. Related habits group into projects with a one-dimensional daily view, and skill trees let you plan progressions, for example raising a reading target from twenty minutes to an hour in planned steps. You can ease into a new routine by starting at once in four days instead of daily, track things you want to reduce as well as build, hover any cell for period details, and rearrange projects and habits by dragging them. Multiple accounts, light and dark themes, keyboard shortcuts, and a polished mobile browser interface round out daily use, and a single command brings the whole thing up with prebuilt images ready to go. Running on a dedicated VPS on RepoCloud with guaranteed CPU, RAM, and SSD, full root SSH access, and a browser serial console. AGPL-3.0 licensed.
Rath
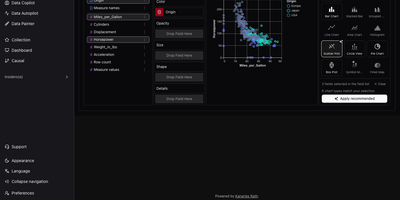
RATH, an automated data exploration workbench, turns any table into a gallery of charts worth reading, without building each chart by hand. Start with a CSV, JSON, or Excel file, or pull tables from MySQL, PostgreSQL, Oracle, SQL Server, SQLite, or Airtable. Eight built-in demo datasets are ready to try. Next comes a profile: every field gets a distribution chart and summary statistics. A metadata view retags fields as dimensions or measures. Data Autopilot then searches the dataset and pages through generated insight charts. Charts can be starred, exported, or opened in the editor. Starting from a single field, Data Copilot lists associated patterns to follow, with controls to add variables, filters, and computations. For hands-on work, the drag-and-drop chart builder offers fifteen chart types, including heat maps, box plots, and maps, plus a button that applies the recommended chart. With Data Painter, you brush points into up to ten labeled color groups or erase anomalies, then search for a chart that explains the painting. Causal analysis runs one of ten discovery algorithms, including PC, FCI, GES, and GRaSP. It then draws a directed graph with influence percentages, plus charts and statistics for any field you select. Dashboards combine titles, text, and charts in movable, resizable cards with four themes and global filters. Running on a dedicated VPS on RepoCloud with guaranteed CPU, RAM, and SSD, full root SSH access, and a browser serial console. AGPL-3.0 licensed.
CSV AI Analyzer
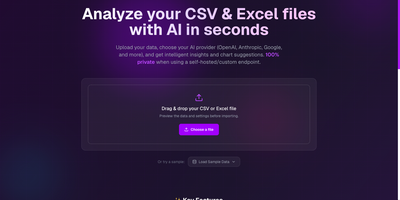
A spreadsheet goes in, a plain-English readout comes out, and with a local model the file never leaves your own network. CSV AI Analyzer reads CSV and Excel files, detects delimiters, headers, and column types, and opens with a data-quality report that counts missing values, repeated rows, and type mismatches per column. A searchable preview table sits next to column, sort, and filter controls. One click on Run Complete Analysis produces a summary with key insights, an anomalies view, and chart suggestions, and the Custom Query tab answers follow-up questions in a chat thread. Charts come as bar, line, pie, scatter, or area, can be built by hand from any two columns, and export as SVG, PNG, or CSV. Reports download as PDF or Markdown. Point it at OpenAI, Anthropic, Google, Mistral, or any OpenAI-compatible endpoint, including Ollama, LM Studio, and vLLM, to keep analysis fully local. API keys stay encrypted in the browser, and a language selector switches the interface. Monthly finance exports, operations reports, and founder dashboards turn into answers without a single formula. Running on a dedicated VPS on RepoCloud with guaranteed CPU, RAM, and SSD, full root SSH access, and a browser serial console. MIT licensed.