Categories
Developer Tools Data Visualization GitHub Analytics Open Source Metrics Star History Repository Insights Time Series Charts Trend AnalysisStars
Forks
Watchers
Developer links
Daily Stars Explorer
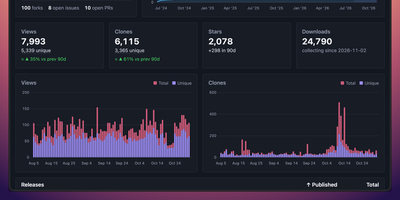
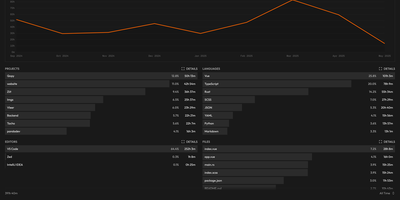
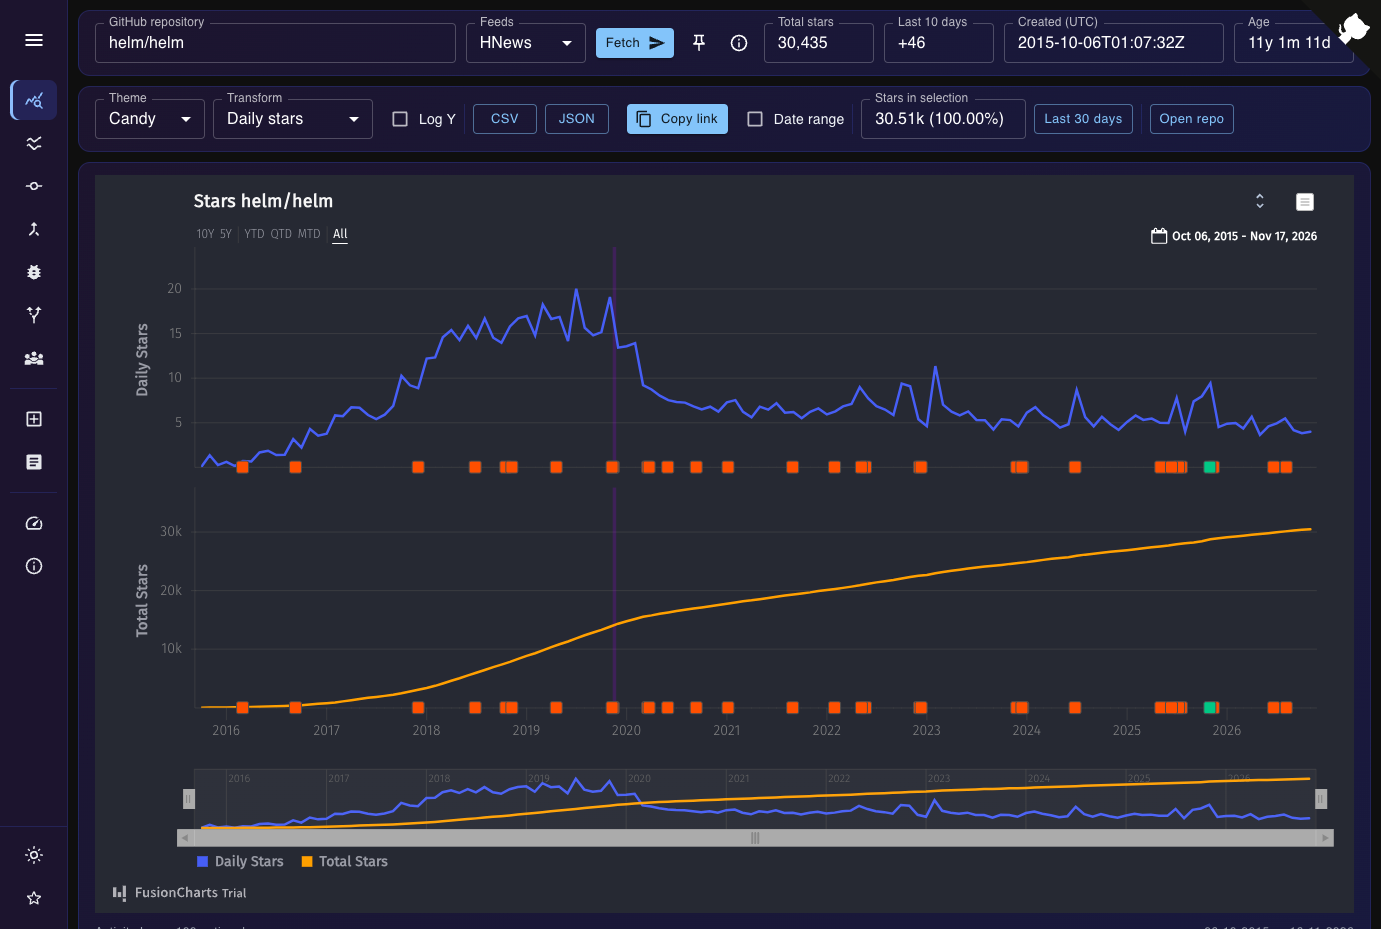
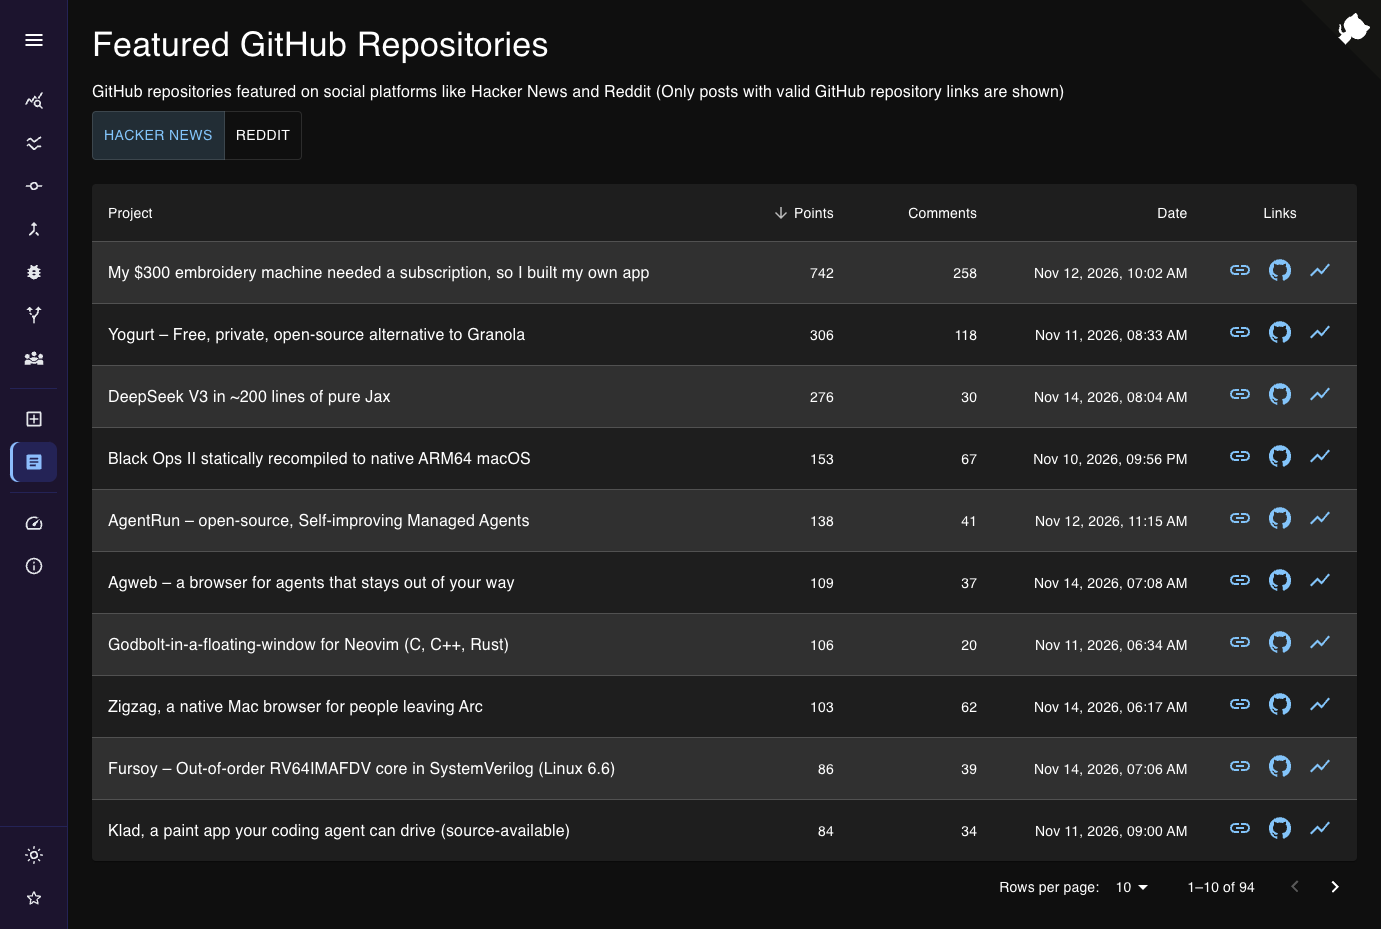
From a one-day Hacker News spike to a decade of steady growth, Daily Stars Explorer charts any GitHub repository's star history day by day, next to the releases and mentions that explain it. Type an owner and repository name, and daily and cumulative stars appear. Range shortcuts: 10Y, 5Y, YTD, QTD, MTD, and All. Zoom with a draggable lower navigator, switch to a Log Y axis, and read the stars gained inside the selected window. Transforms reshape the series. A trend line projects 30 days ahead. Yearly, monthly, or weekly grouping. Peak normalization. LOESS smoothing. Running average and median. First and second derivatives. Weekly growth rate. Feed overlays, enabled by optional provider credentials, mark releases and mentions from Hacker News, Reddit, GitHub, and YouTube right on the curve. Compare two already-fetched repositories on shared axes, with an aggregate selector, Log Y, and optional star milestones, then copy the link. With a GitHub token, separate pages chart commits, with the longest gap highlighted on demand, plus pull requests, issues, forks, and contributors. Global activity counts the public repositories or pull requests created on GitHub each day. Featured repos lists Hacker News and Reddit posts that link to GitHub projects, sortable by points, comments, or date. Star history, commit, and activity charts export to CSV or JSON. Favorite repositories can be pinned. Running on a dedicated VPS on RepoCloud with guaranteed CPU, RAM, and SSD, full root SSH access, and a browser serial console. MIT licensed.
Benefits
- Spot Why a Repo Took Off
- Feed overlays pin releases and Hacker News, Reddit, GitHub, and YouTube mentions onto the star curve, so a sudden jump can be matched to the launch post or video behind it.
- Compare Two Projects on One Axis
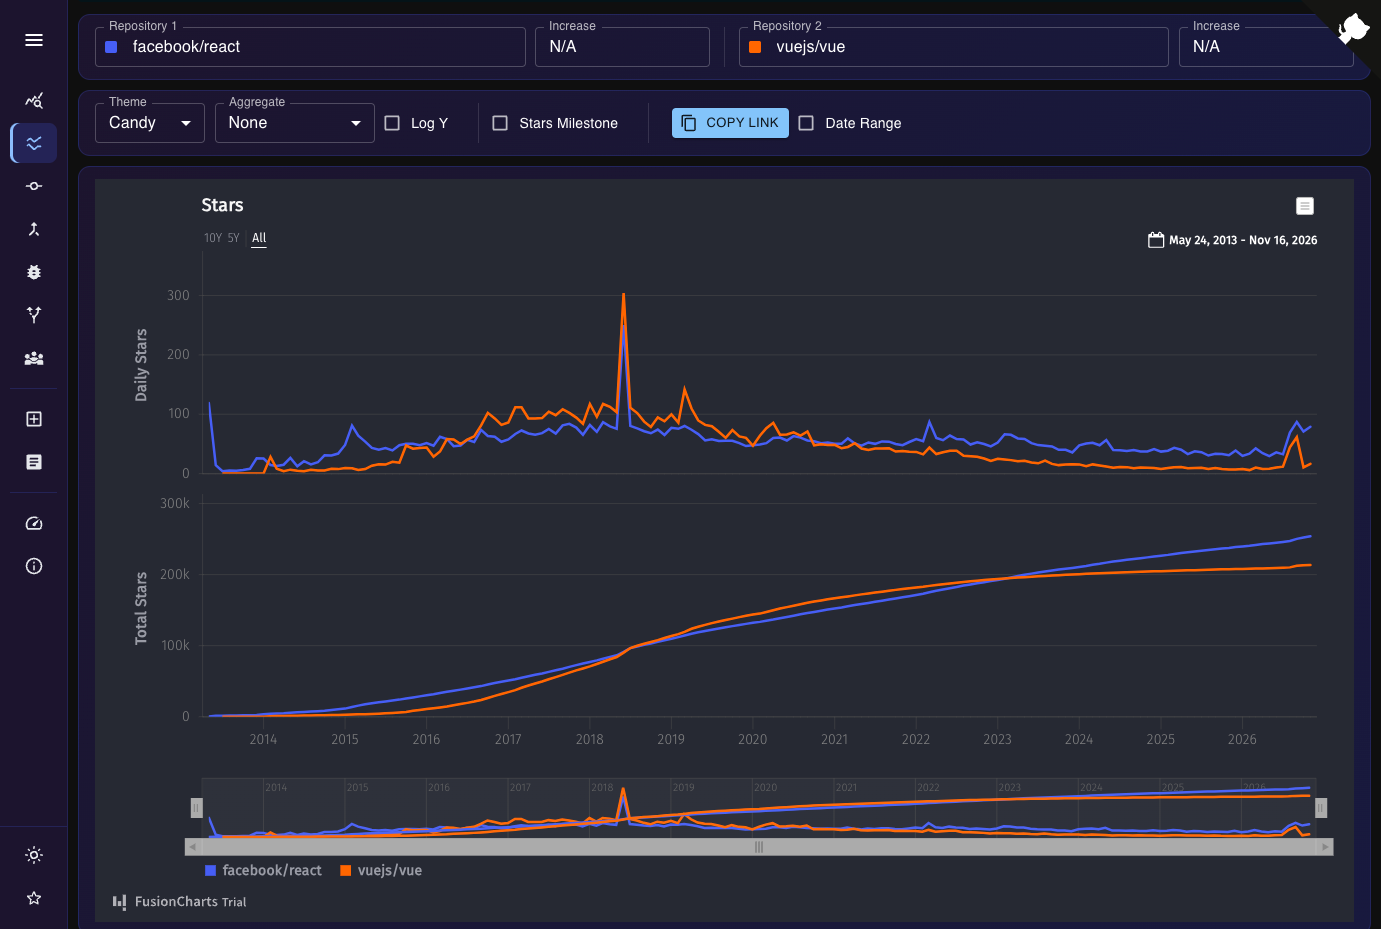
- The compare page draws two already-fetched repositories on shared axes, with a Log Y option for very different sizes, an Increase counter for any zoomed window, and a copyable link.
- Read Growth Beyond Raw Counts
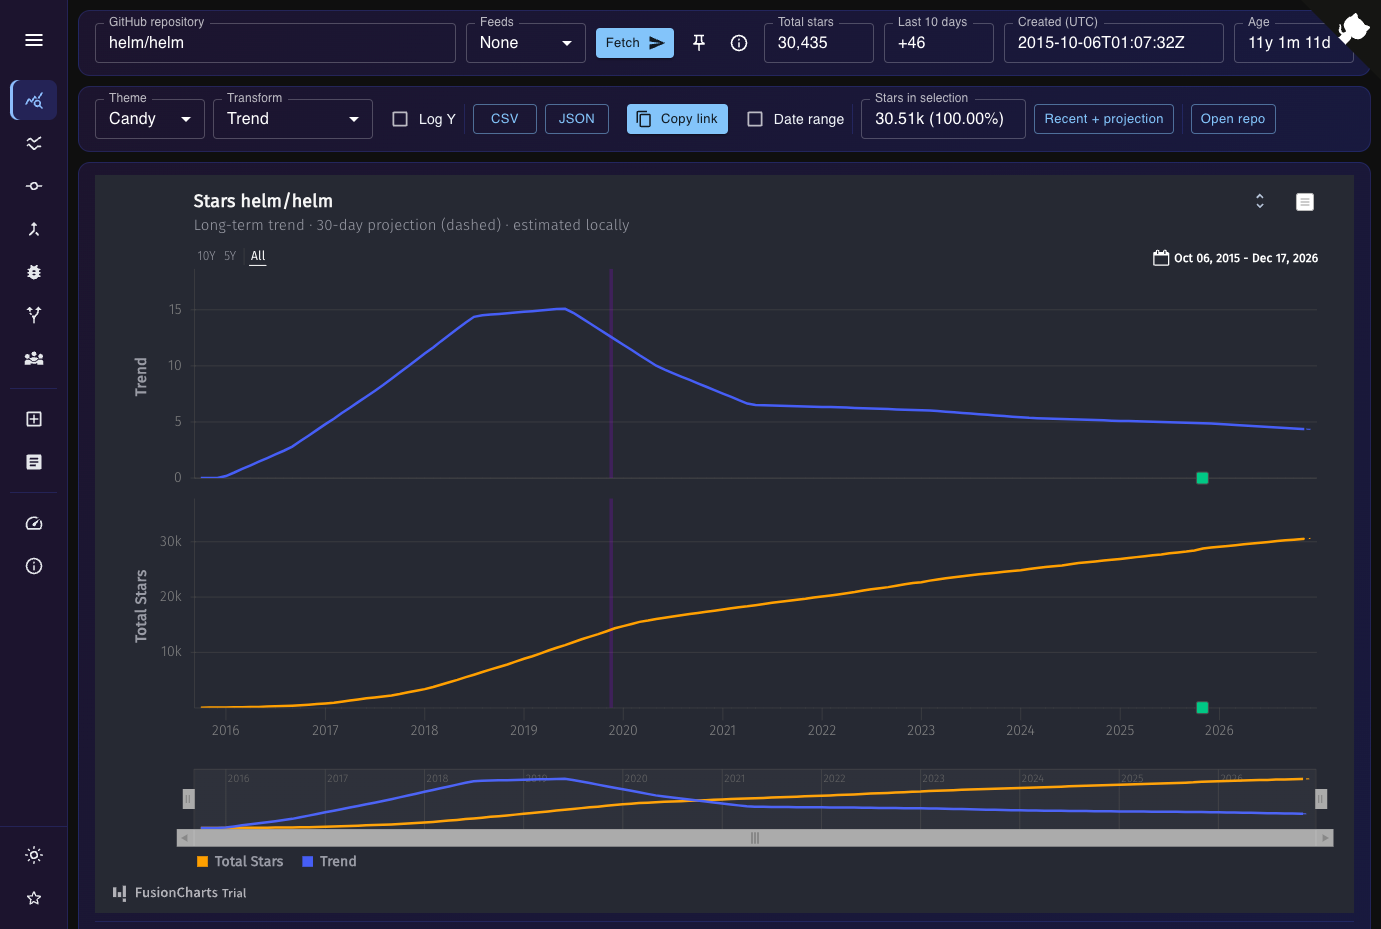
- Transforms such as a 30-day trend projection, LOESS smoothing, running averages, derivatives, and weekly growth rate turn noisy daily star counts into readable momentum signals.
- Self-Host With an Optional Token
- Star charts work without a token within GitHub's 60 unauthenticated requests per hour; a token with no repository access lifts that to 5,000 and unlocks commit, pull request, issue, fork, and contributor timelines.
Features
- Daily Star History Charts
- Plots daily and cumulative stars from GitHub's star-history endpoint with 10Y, 5Y, YTD, QTD, MTD, and All shortcuts, a draggable navigator, Log Y scaling, and a stars-in-selection counter.
- Series Transforms and Trends
- Switch between trend with projection, year, month, and week grouping, peak normalization, LOESS smoothing, running average and median, first and second derivatives, and weekly growth rate.
- Feed Mention Overlays
- Optional provider credentials enable overlays of releases and mentions from Hacker News, Reddit (strict or broad), GitHub, and YouTube on the star curve, explaining spikes.
- Repository Activity Timelines
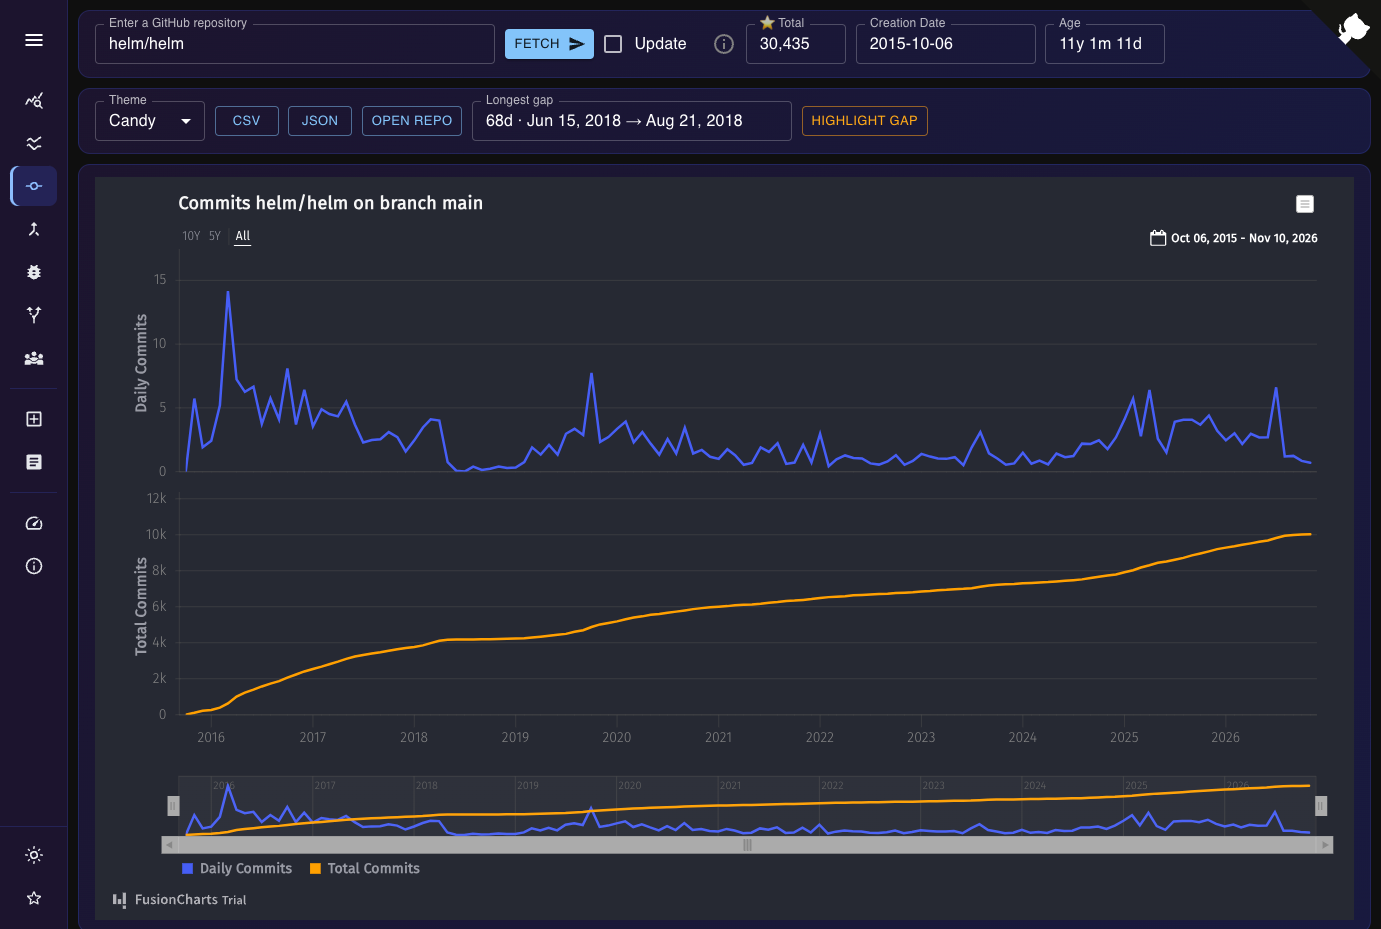
- Dedicated pages chart commits with a highlightable longest gap, pull requests, issues, forks, and contributors over time; these timelines need a GitHub token.
- Repository Comparison View
- Compare two already-fetched repositories on shared axes with an Aggregate selector, Log Y scaling, optional star milestones, per-repository Increase counters, and a copyable link.
- Global Activity and Featured
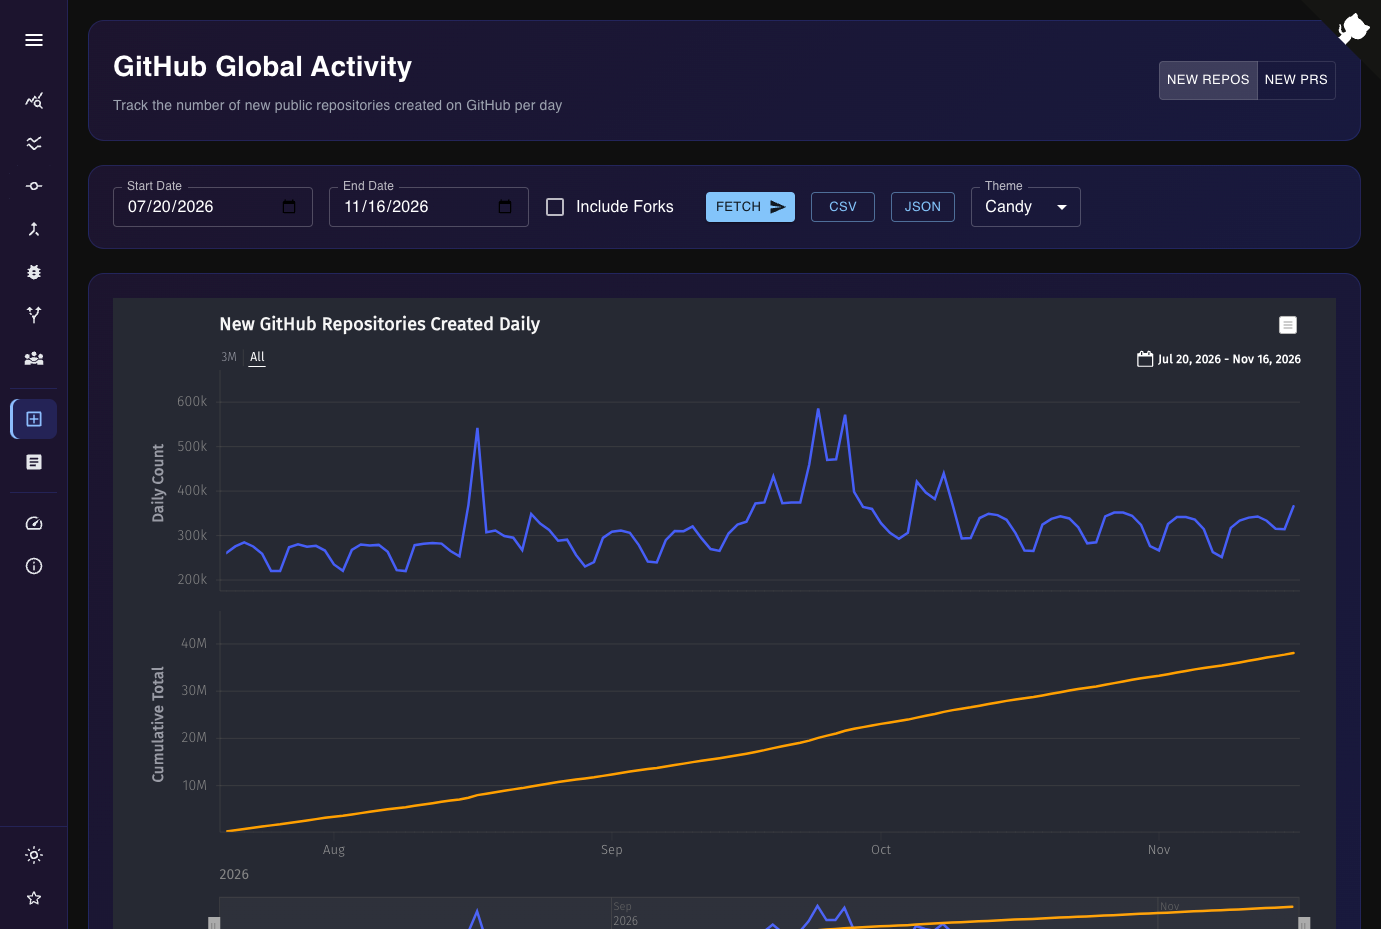
- Global activity charts public repositories and pull requests created on GitHub daily; Featured repos lists Hacker News and Reddit posts linking to GitHub projects, sortable by points, comments, or date.