Categories
Developer Tools Self-Hosted AI Data Visualization Business Intelligence Data Analysis AI Analytics Spreadsheet Analysis CSV ToolsStars
Forks
Watchers
Developer links
CSV AI Analyzer
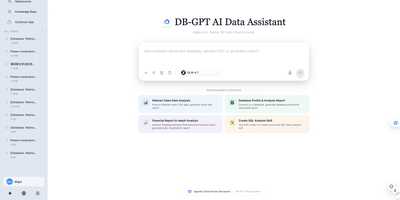
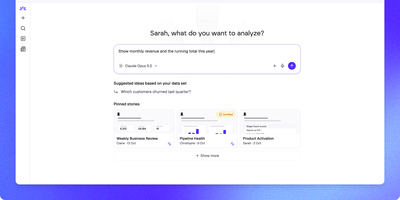
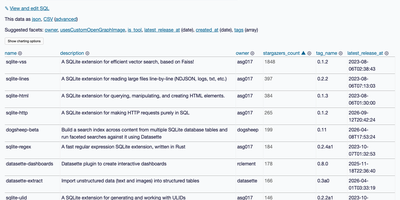
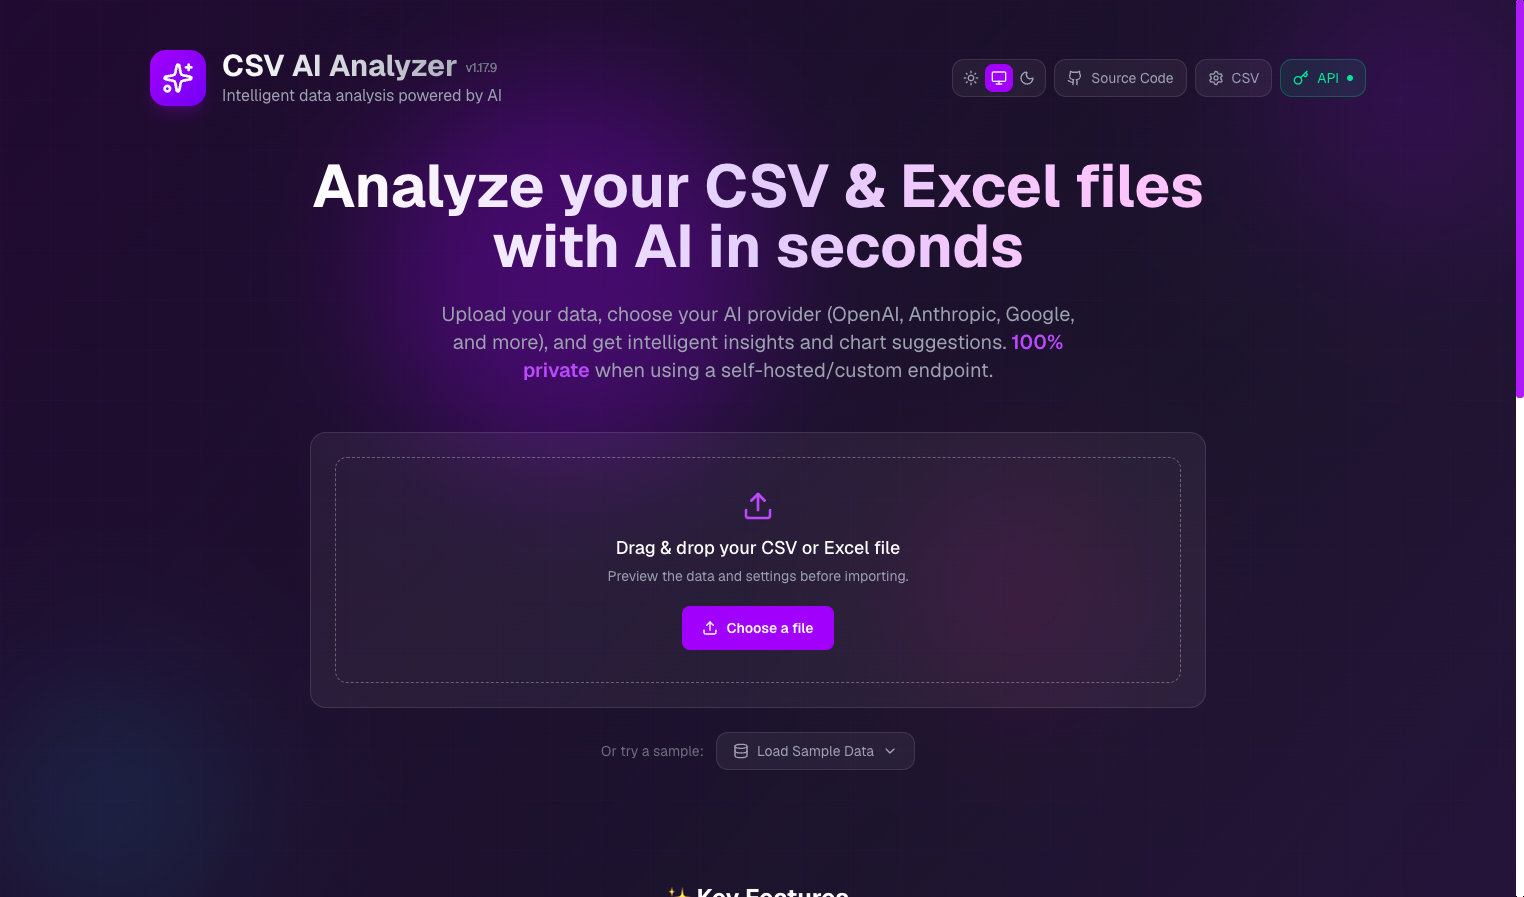
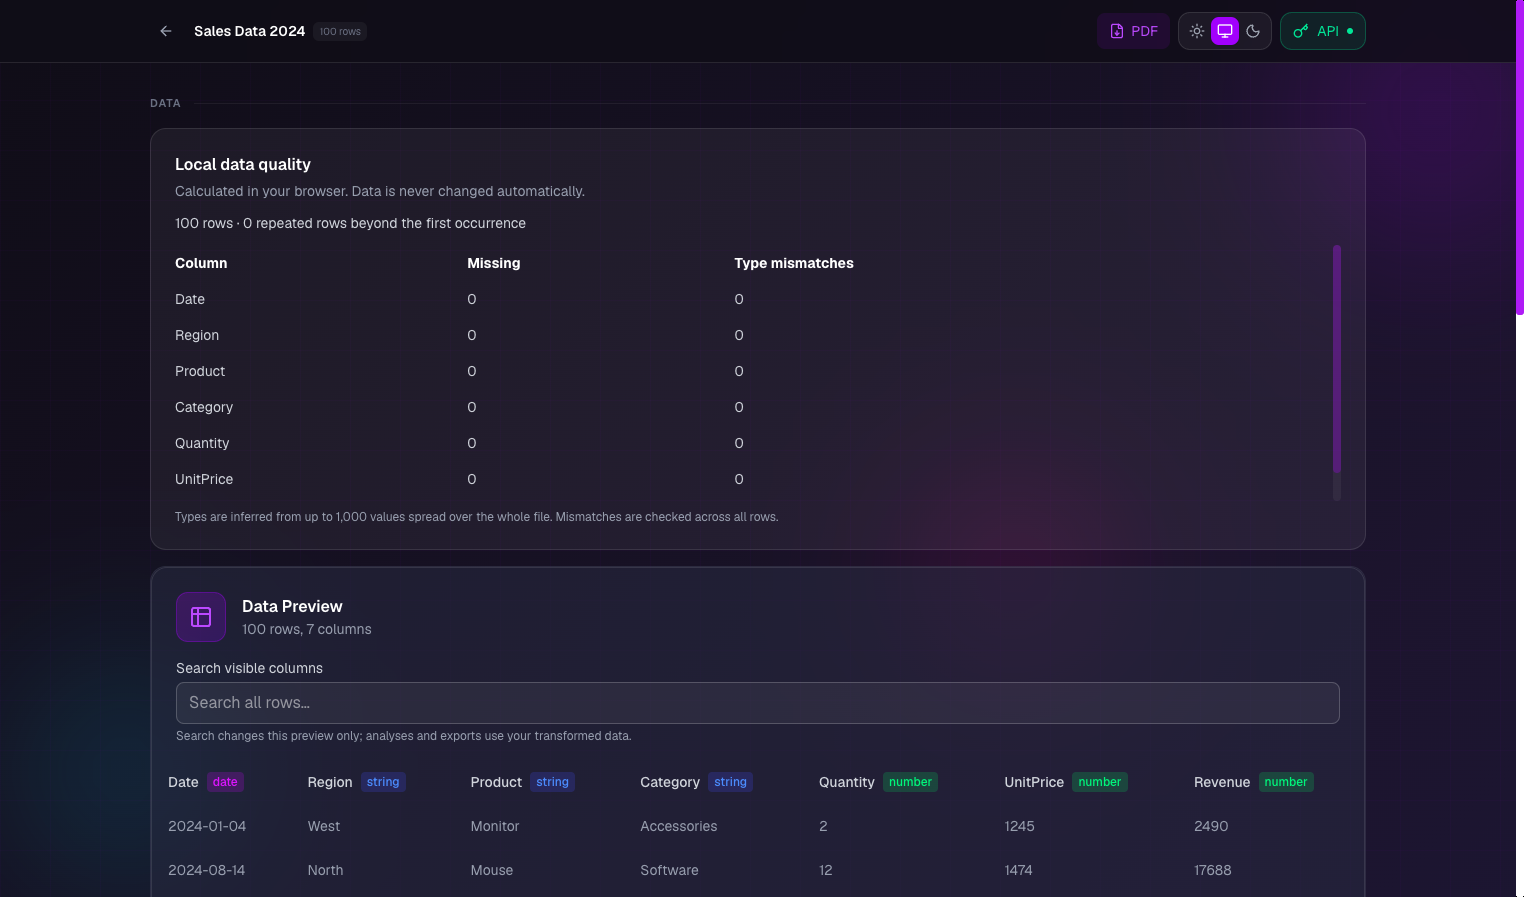
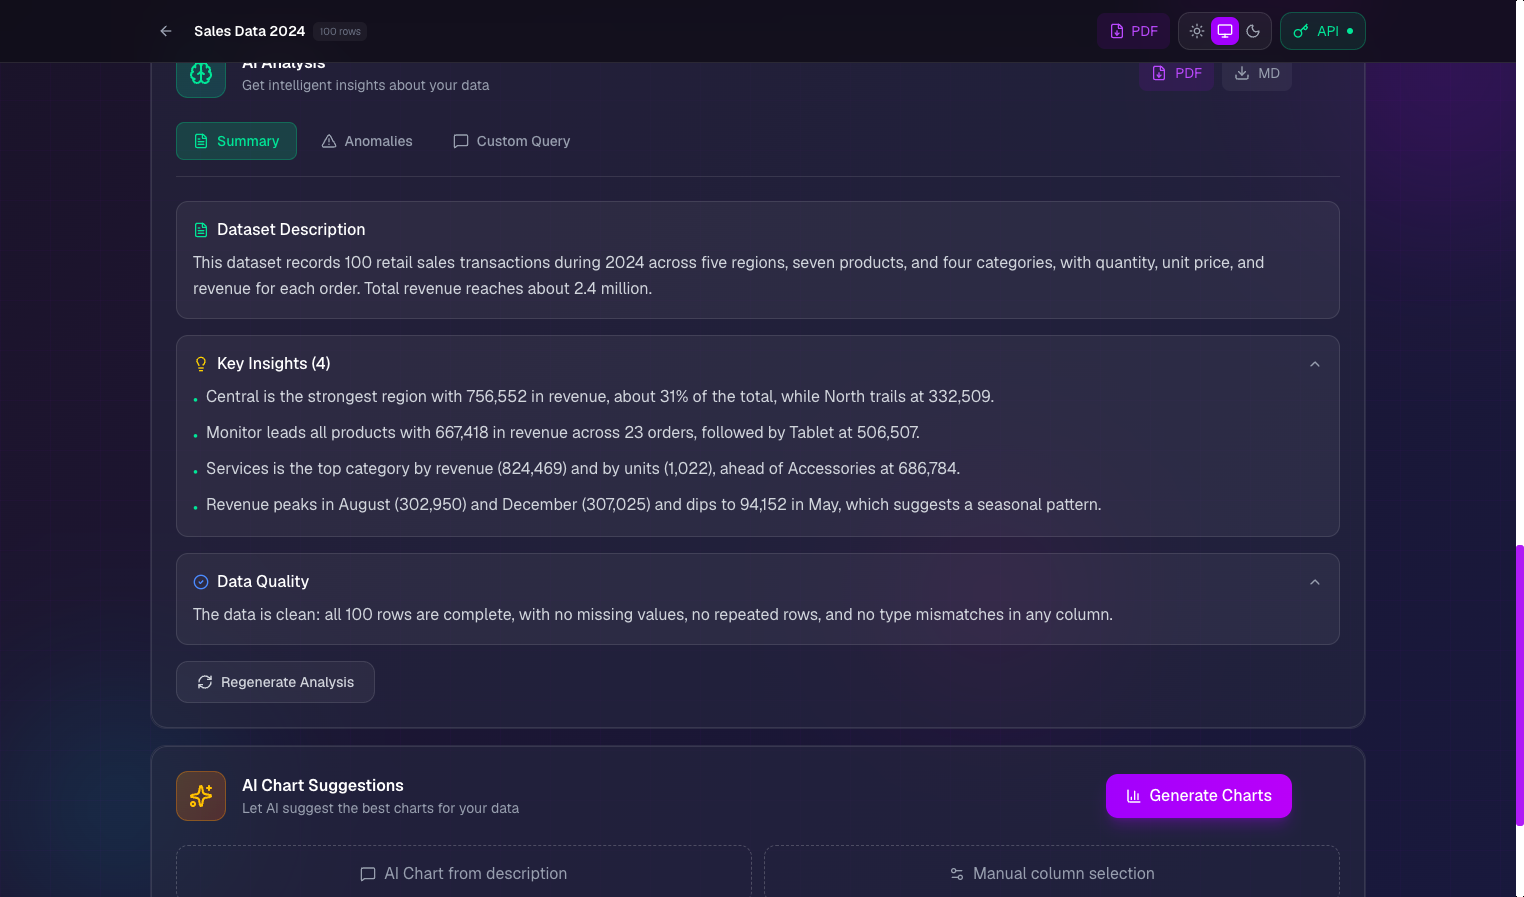
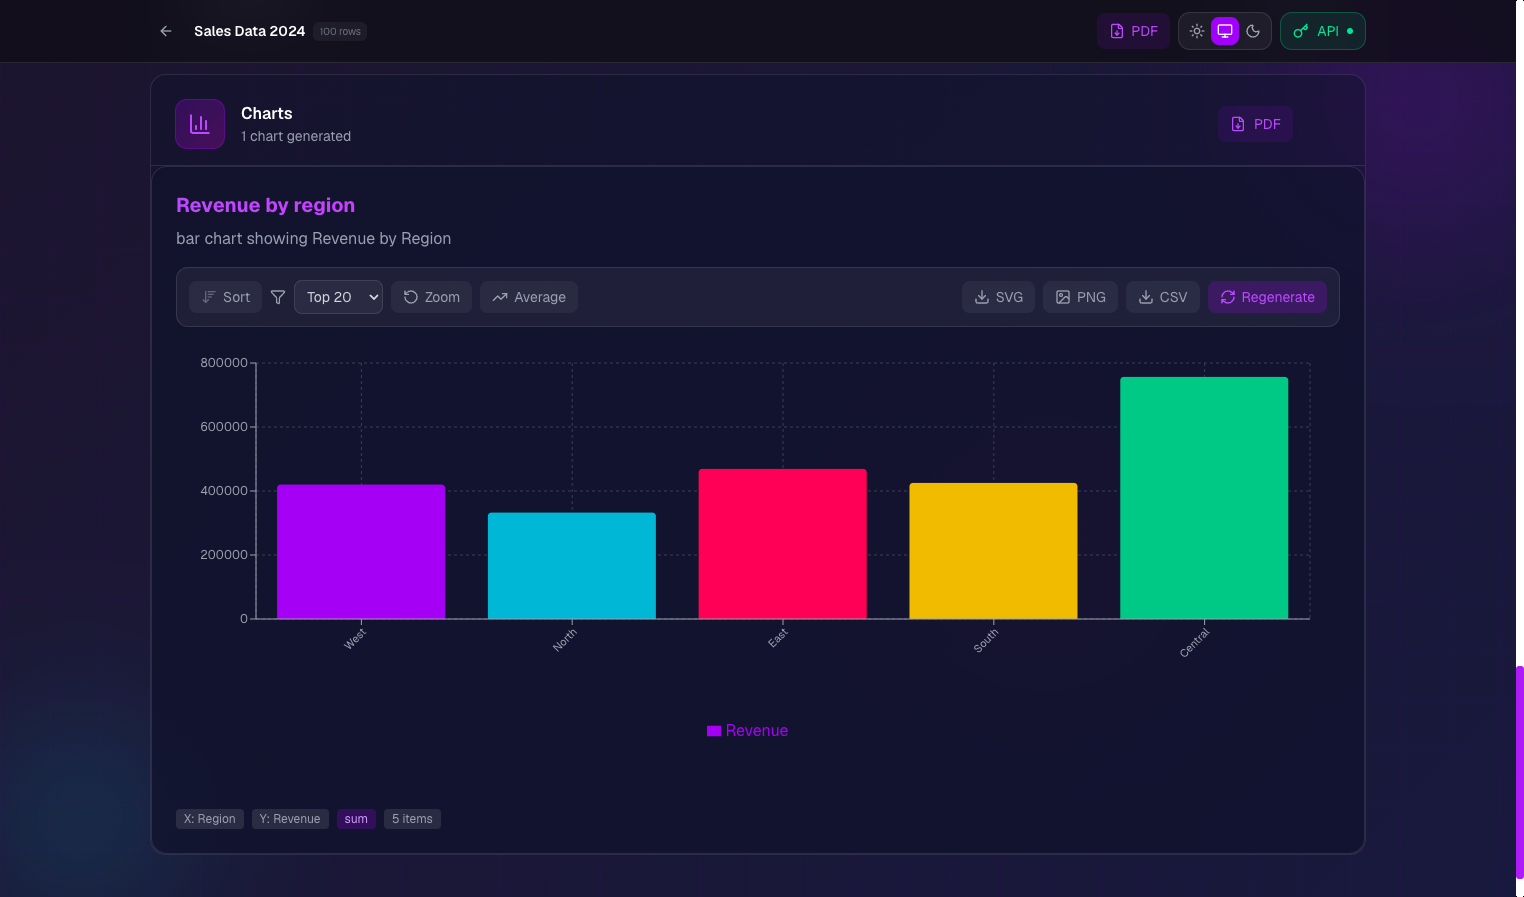
A spreadsheet goes in, a plain-English readout comes out, and with a local model the file never leaves your own network. CSV AI Analyzer reads CSV and Excel files, detects delimiters, headers, and column types, and opens with a data-quality report that counts missing values, repeated rows, and type mismatches per column. A searchable preview table sits next to column, sort, and filter controls. One click on Run Complete Analysis produces a summary with key insights, an anomalies view, and chart suggestions, and the Custom Query tab answers follow-up questions in a chat thread. Charts come as bar, line, pie, scatter, or area, can be built by hand from any two columns, and export as SVG, PNG, or CSV. Reports download as PDF or Markdown. Point it at OpenAI, Anthropic, Google, Mistral, or any OpenAI-compatible endpoint, including Ollama, LM Studio, and vLLM, to keep analysis fully local. API keys stay encrypted in the browser, and a language selector switches the interface. Monthly finance exports, operations reports, and founder dashboards turn into answers without a single formula. Running on a dedicated VPS on RepoCloud with guaranteed CPU, RAM, and SSD, full root SSH access, and a browser serial console. MIT licensed.


Benefits
- Answers From Raw Exports
- Drop in a CSV or Excel file and get a summary, key insights, and anomaly review without writing formulas, pivot tables, or a single line of code.
- Keep Sensitive Data Local
- Connect an Ollama, LM Studio, or vLLM endpoint on your own server so analysis stays inside your environment, and the app itself stores none of your data.
- Trust The Data First
- A local quality report counts missing values, repeated rows, and type mismatches for every column, so you can spot problems before the AI draws conclusions.
- Charts Without Spreadsheet Work
- Accept suggested charts or build your own from any two columns, then export finished visuals as SVG, PNG, or CSV for slides and reports.
Features
- Smart File Parsing
- Upload CSV or Excel files with automatic delimiter, header, and type detection, and adjust encoding or header rows when the defaults need a nudge.
- One-Click Complete Analysis
- Generate a dataset description, key insights, a data-quality assessment, anomaly findings, and chart suggestions in a single run from one button.
- Custom Query Chat
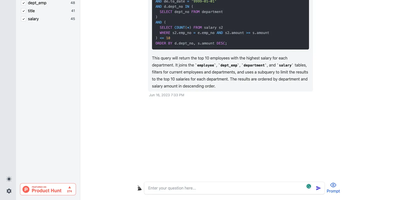
- Ask follow-up questions about your data in a chat thread and read formatted Markdown answers with lists, tables, and figures drawn from the dataset.
- Interactive Chart Builder
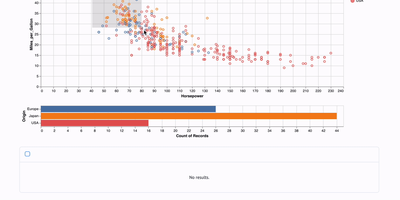
- Choose bar, line, pie, scatter, or area charts, pick columns and an aggregation like sum, and zoom, sort, or filter the result.
- Provider And Endpoint Setup
- Pick a hosted provider and model, or switch on a custom endpoint with a base URL and model name for local servers.