Frappe Insights
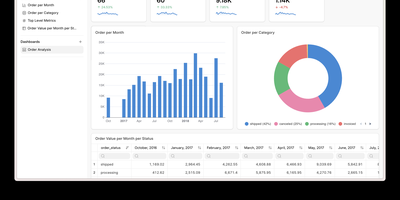
Frappe Insights delivers a self-hosted business intelligence platform where non-technical users build complex analytical queries without writing SQL. The visual query builder uses Ibis under the hood to compose optimized SQL from drag-and-drop column selections, filters, aggregations, and group-by operations — translating point-and-click interactions into performant database queries across MySQL, PostgreSQL, DuckDB, and BigQuery. The join editor provides a graphical interface for defining multi-table relationships, letting analysts connect data across schemas without understanding foreign keys or join types. The chart builder renders interactive visualizations using Apache eCharts with support for bar, line, area, pie, scatter, funnel, and pivot table chart types — each configurable with axes, colors, legends, and formatting options. Dashboards combine multiple charts into shareable views with layout customization, auto-refresh intervals, and filter propagation across widgets. Data source management handles connection pooling across multiple databases simultaneously, enabling cross-database analysis in single queries. Server scripts extend query capabilities with custom Python transformations for complex business logic that visual tools cannot express. Built on the Frappe Framework's full-stack architecture, deployment uses Docker via the official easy-install script that provisions the complete stack including MariaDB, Redis, and Nginx. Running on a dedicated VPS on RepoCloud with guaranteed CPU, RAM, and SSD, full root SSH access, and a browser serial console. AGPL-3.0 licensed.
Kula
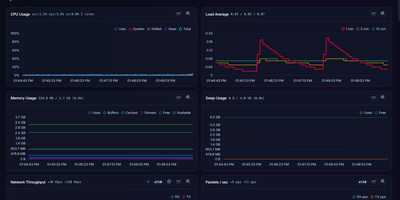
Kula watches a Linux server every second and turns CPU, memory, disks, network, containers, and applications into a live dashboard you can open before trouble becomes downtime. Follow total and per-core CPU, load averages, memory and swap pressure, disk I/O, filesystem space, temperatures, GPU load, and network throughput as charts update live in the browser. Drag to zoom into history, switch to focus or TV mode for a wall display, and check the System Info page when you need the hardware story behind a spike. Watch Docker, Podman, and cgroup containers beside host metrics, then add PostgreSQL, MySQL or MariaDB, nginx, and Apache monitoring or define custom metrics for the odd service only your team understands. Scrape the Prometheus endpoint into an existing observability stack, open the terminal UI over SSH for a quick live read, or ask the optional local Ollama assistant to discuss charts without sending data to a cloud service. Protect the dashboard with optional Argon2id logins and multiple users, schedule storage snapshots, and keep the whole tool working on closed networks with no external calls. Running on a dedicated VPS on RepoCloud with guaranteed CPU, RAM, and SSD, full root SSH access, and a browser serial console. AGPL-3.0 licensed.
Flame
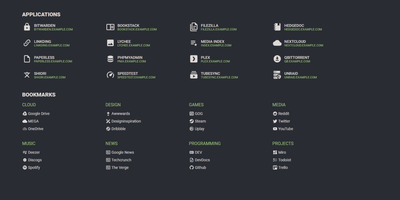
A server full of scattered services becomes one clean application hub under Flame - a self-hosted startpage where every bit of configuration happens in built-in GUI editors, never a config file. Applications and bookmarks are created, edited, and organized into categories directly in the browser, and favorites pin to the homescreen for one-click access. The integrated search bar filters your apps and bookmarks locally as you type, and prefix shortcuts (like /g for Google) route queries to any of 11 web search providers or custom ones you define, making Flame a genuine browser homepage rather than a static link wall. Docker integration is the standout for homelabs: mount the Docker socket, add flame.type, flame.name, and flame.url labels to containers, and new services appear on the dashboard automatically - Kubernetes Ingress annotations work the same way. A weather widget shows temperature, cloud coverage, and animated conditions for your coordinates, and password authentication protects settings and items. Appearance is deeply customizable with 15 built-in color themes, a custom theme builder, and full custom CSS support. The stack is Node.js with SQLite behind a React frontend - light, fast, and inspired by the minimalist SUI design.
Apache Superset
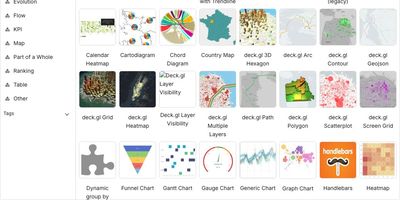
Powering data analytics at companies like Airbnb, Twitter, and Lyft where it originated, Apache Superset has become the leading open-source business intelligence platform with over 65,000 GitHub stars and an Apache Software Foundation top-level project designation. The platform ships with over forty visualization types out of the box including geographic maps, time-series charts, pivot tables, heatmaps, treemaps, and Sankey diagrams, all rendered with Apache ECharts for publication-quality output. Its SQL Lab provides a full-featured IDE experience with syntax highlighting, autocomplete, query history, and result caching for interactive data exploration. Superset connects natively to PostgreSQL, MySQL, ClickHouse, Trino, Presto, BigQuery, Snowflake, Apache Druid, Apache Hive, and dozens more databases through SQLAlchemy connectors, with support for custom database drivers via Python plugins. The semantic layer allows data teams to define calculated columns, metrics, and virtual datasets that business users can query without writing SQL. Role-based access control with row-level security enables fine-grained data governance, while the embedded analytics SDK lets you integrate dashboards directly into external applications via iframes with SSO pass-through. The caching layer supports Redis and Memcached for query result caching, and the asynchronous query execution engine powered by Celery handles long-running queries without blocking the UI. Alerts and reports can be scheduled via email or Slack with PNG or CSV attachments generated from any chart or dashboard. Running on a dedicated VPS on RepoCloud with guaranteed CPU, RAM, and SSD, full root SSH access, and a browser serial console. Apache 2.0 licensed.
Marketing Dashboard
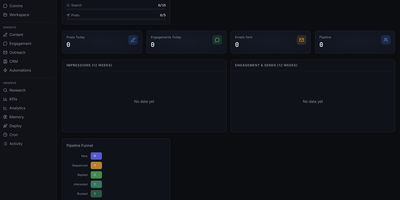
This is a marketing operations control center that replaces fragmented CRM, outreach, content, and analytics tools with a unified self-hosted interface designed for AI agent-assisted go-to-market teams. The CRM module manages leads through a configurable pipeline funnel with stages from New through Sequenced, Replied, Interested, and Booked, tracking source attribution, industry segments, company size, lead quality scores, and LinkedIn URLs per contact. Outreach sequencing supports email campaigns with pause controls, audit endpoints, suppression workflows, and engagement tracking. The content operations surface provides calendar views, content item management, performance metrics, and approval queues for editorial control. Analytics and KPI dashboards show impressions, engagement, and send volumes over configurable time periods, with optional connectors to Plausible, Google Analytics 4, X, and LinkedIn for cross-platform reporting. The OpenClaw-native agent runtime enables dynamic agent and squad discovery, workspace management, session monitoring, and communications surfaces. Automation scheduling uses cron job templates with OpenClaw-compatible schedule variants including cron expressions, every intervals, and at timestamps. The tech stack combines Next.js 16 App Router with React 19, Tailwind CSS 4, Recharts, and Zustand for state management. Authentication supports session cookies, API keys, and optional Google OAuth with role-based access controls. All state persists locally in SQLite via better-sqlite3 with no required external infrastructure. On RepoCloud, deploy Marketing Dashboard on a dedicated VPS with persistent SQLite storage, root SSH access, and complete control over your marketing operations data, all under the MIT license.
Larapaper
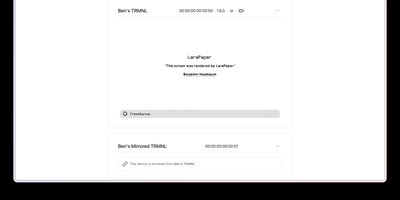
An e-ink frame on your kitchen wall should show your calendar, not beg a cloud subscription for permission; Larapaper is the self-hosted TRMNL server that keeps those screens yours. Devices on your network announce themselves and auto-join, and the admin panel tracks each unit's battery, WiFi strength, firmware, and current screen, from the official TRMNL OG and X to SeeedStudio DIY kits, reTerminal panels, Kindle and Kobo e-readers, and Raspberry Pi displays. Content comes from wherever you like: native plugins and recipe mashups, more than a thousand catalog recipes importable from TRMNL and the community, your own Liquid or Blade markup written in the web editor, or a simple POST to the screen API from any script. Playlists rotate screens on a schedule, so the morning shows trains and weather while the afternoon shows the build board. The render pipeline draws with headless Chrome, converts through ImageMagick to each device's exact palette, and caches results so sleepy e-ink clients wake, fetch, and sleep again in seconds. Run it beside the official cloud as a proxy when you want hybrid coverage, on SQLite for a shelf box or Postgres for a fleet, with dark mode in the admin and Docker Compose for deployment. Running on a dedicated VPS on RepoCloud with guaranteed CPU, RAM, and SSD, full root SSH access, and a browser serial console. MIT licensed.
ghstats
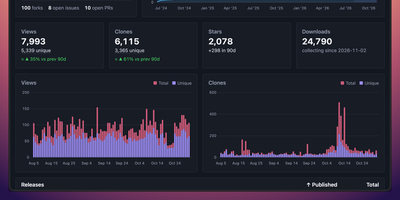
GitHub forgets your traffic after fourteen days; ghstats remembers it for years. This self-hosted dashboard polls the GitHub API every hour and keeps views, clones, stars, forks, issues, and pull requests for every repository in its own database, long after the built-in traffic tab has rolled over. Open a repository to see its charts for stars, clones, and views next to top referrers and popular paths, filter the list by owner, name, forks, or archived status, and include private repositories when your token allows it. Public stats pages and portfolios reuse the same numbers through a JSON API, embeddable SVG badges for views, clones, and star velocity, and cards ranking your top repositories or showing star history across projects. Release download counts accumulate as daily snapshots too, so a launch spike stays visible months later. The whole service is one small Docker image on port 8080 with a single file for storage, easy to back up and easy to move. Running on a dedicated VPS on RepoCloud with guaranteed CPU, RAM, and SSD, full root SSH access, and a browser serial console. MIT licensed.
Edi Life OS
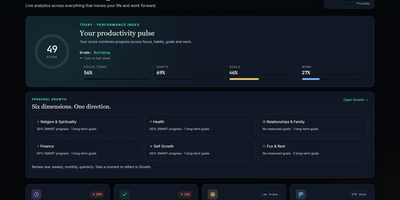
Edi Life OS puts the habits, goals, projects, money, focus sessions, and notes that usually live in five separate apps into one calm dashboard on your own server. Start the day from an Overview that rolls focus, habit trends, goals, finances, and the week ahead into one readable score. Connect long-term goals to six life areas, drive progress from a checklist, a measure, or a habit you actually keep, and use weekly, monthly, or quarterly reviews to choose the next honest step. Log daily habits with streaks and monthly progress, run timed focus sessions with short and long breaks, and keep a history of the deep work you finished. Track expenses, income, budgets, debts, and credits in your chosen currency, including recurring entries that land straight in the ledger. Plan projects on draggable Kanban boards with labels, priorities, due dates, checklists, comments, and attachments, then see card deadlines and money dues together in one calendar. Capture Markdown notes with preview and export, pin sticky notes with colors and connections, and give each account its own private workspace, theme, and currency. Ask an AI assistant through the optional MCP server to read your dashboard, create goals, log habits, or record expenses through a token-protected API that never touches the database directly. Running on a dedicated VPS on RepoCloud with guaranteed CPU, RAM, and SSD, full root SSH access, and a browser serial console. MIT licensed.
Appsmith
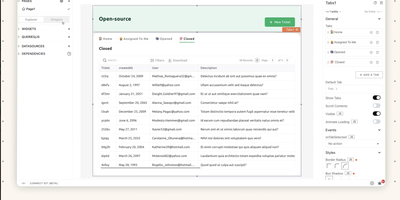
Admin panels, database GUIs, dashboards, approval flows, customer support consoles - Appsmith builds the internal tools your team keeps postponing, on an open-source low-code platform. The UI assembles from 45+ drag-and-drop widgets - tables with server-side pagination and inline editing, charts, forms, lists, buttons - which bind to data through {{ }} JavaScript expressions anywhere in the editor. Datasources cover PostgreSQL, MySQL, MongoDB, MS SQL, Redis, Snowflake, and more, plus any REST or GraphQL API, with SaaS integrations and AI query support for prompt-based steps inside apps. When the widget library falls short, custom widgets are plain JavaScript, HTML, and CSS, and external JS libraries can be imported, which keeps the platform extensible where pure no-code tools hit walls. Git-based version control enables branch-based collaboration, review, and rollback of app definitions. Queries and JS objects hold the business logic layer between datasources and UI. Self-hosted via Docker or Kubernetes, with role-based access control for published apps.
GoAccess
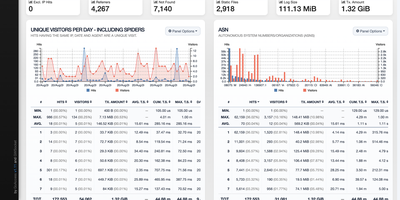
GoAccess processes millions of web log entries in seconds and renders the results as interactive dashboards that update every 200 milliseconds in the terminal or every second via WebSocket-connected HTML reports. Written entirely in C with only ncurses as a dependency, it achieves exceptional performance even on resource-constrained servers, reducing memory usage by approximately 20% and parsing time by 35% in recent releases through optimized in-memory hash tables with on-disk persistence support. The analyzer parses virtually every web log format out of the box (Apache Combined and Common, Nginx, Amazon CloudFront, Amazon S3, AWS Elastic Load Balancing, Google Cloud Storage, Squid, W3C IIS, Caddy JSON, and Traefik) while supporting fully custom log format strings for non-standard configurations. The self-contained HTML dashboard displays 15+ interactive panels covering unique visitors, requested files, static files, 404 errors, referring sites, search keyphrases, geographic location with city-level GeoIP resolution, operating systems, browsers, HTTP status codes, time distribution, and virtual host metrics. WebSocket authentication via JWT provides secure remote access, and incremental log processing ensures data continuity across daemon restarts. Docker deployment requires a single command with volume-mapped access logs. Over 20,800 stars with active development since 2010. Running on a dedicated VPS on RepoCloud with guaranteed CPU, RAM, and SSD, full root SSH access, and a browser serial console. MIT licensed.
Tesserae
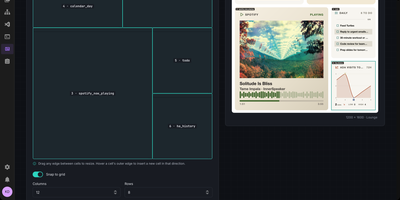
Built for e-ink screens, Tesserae composes calm wall dashboards from your calendar, weather, and Home Assistant data in a browser, then renders each frame at the panel's exact resolution. Lay out pages as a grid of cells or on a free canvas of widgets, text, and shapes, with a live preview. What you see is what paints. Dozens of bundled widgets cover weather, calendars, clocks, news, to-do lists, and photos, and a community catalog adds more widgets, themes, and templates. Frames are dithered to each panel's measured palette, so photos and gradients stay clean on Spectra 6 color, mono, and grayscale screens. One server drives a whole fleet. Each panel keeps its own dashboards, schedules, and rotations, and smart sync renders just before a battery panel wakes while quiet hours let it sleep overnight. Seeed reTerminal and XIAO panels flash from the browser, and Pimoroni Inky, Waveshare, M5Stack, TRMNL-compatible devices, and KOReader Kindles and Kobos work too. Inside Home Assistant it runs as a sidebar App. Home Assistant widgets show entities, history, energy, and cameras, and MQTT discovery turns each panel into a device with its frame, battery level, and signal. No account is needed, and update checks stay off unless you opt in. Ask Claude or any MCP client to lay out a dashboard, check a preview, and push it. Running on a dedicated VPS on RepoCloud with guaranteed CPU, RAM, and SSD, full root SSH access, and a browser serial console. AGPL-3.0 licensed.
AliangBoard
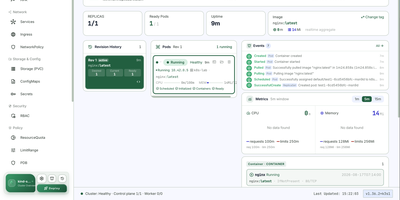
AliangBoard puts every Kubernetes cluster you run behind one web panel, where you manage resources yourself or ask an AI agent to do it with your approval. Connect each cluster with a bearer token or basic auth and the panel persists the connection, so switching clusters, namespaces, and workloads takes one click instead of another kubeconfig. More than thirty resource types stay in sync: create workloads, services, ingress, config, storage, and RBAC through structured forms, edit anything as YAML, apply multi-document manifests at once, and delete optimistically with automatic rollback when the API refuses. Pod work goes deep: a tmux-backed exec terminal survives browser refreshes, port-forwards resolve services to their backend pods, files move up and down with progress, and debug containers inject into running pods without restarting them. Day-two operations are buttons, not flag memorization: scale, rolling restart, rollout undo, manual CronJob triggers, and node cordon or drain. Global search, a layered namespace topology, live event streams, and CPU and memory metrics keep orientation effortless. Then there is the operator: an Agent workbench and MCP server let your LLM read logs, debug containers, and propose changes in natural language, while every write waits for a human click and lands in an audit log that names who did what. Running on a dedicated VPS on RepoCloud with guaranteed CPU, RAM, and SSD, full root SSH access, and a browser serial console. Apache-2.0 licensed.
Mularr
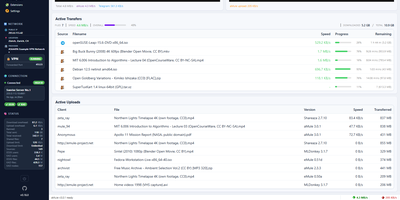
Classic eD2k and Kad downloading gets a browser interface with the look of Windows XP, Windows Classic, a clean modern dashboard, or green-on-black Hacker mode. Mularr wraps an aMule daemon and shows live download and upload graphs, active transfers with progress and remaining time, and the uploads other clients are pulling. Transfers can be started, paused, stopped, categorized, and bulk imported from ED2K links. Servers, search, shared files, categories, and extensions each get their own page. For automation it presents itself as a qBittorrent download client and a Torznab indexer, so Sonarr and Radarr can use it with their standard settings. Extensions for Sonarr and Radarr read the Wanted list and publish matches into a feed the apps can poll. Telegram can act as an extra download provider and notification channel, and Hispashare releases appear in search results next to aMule's. A VPN panel reports Gluetun health and the forwarded port, and the settings page covers ports, bandwidth limits, IP filters, a blacklist, and shared folders. One container image and a single data volume are enough to get started. Running on a dedicated VPS on RepoCloud with guaranteed CPU, RAM, and SSD, full root SSH access, and a browser serial console. MIT licensed.
TapMap
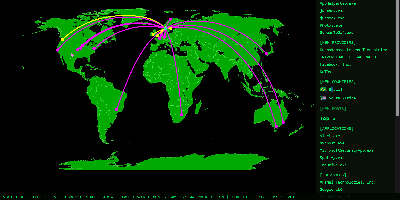
TapMap draws a computer's live network connections on an interactive world map, so you can watch which applications are talking to which services, where those services sit, and what normal looks like for that machine. A local pipeline scans active sockets, extracts the remote addresses, and enriches them with geolocation from databases stored on the machine itself. Every connection carries the owning application or process, its network operator, and the operating system's verification status for that app, and places that share a location are highlighted when connections overlap. The same view lists local open ports, both TCP listeners and bound UDP sockets, established services on your LAN, and public services whose location could not be mapped. A rolling 30-day history turns raw connections into awareness: an Insights panel surfaces new applications, providers, countries, and ports, plus the most frequent activity, while a Significant Connections log records first sightings and failed verifications. A Daily Activity Report goes further, sorting applications into seen-once, occasional, recurring, and stable patterns, analyzing provider concentration, and charting country activity with detailed timelines. New significant connections can raise a desktop notification or publish to an MQTT broker you configure. Nothing is sent anywhere by default: processing happens locally, with no telemetry. Running on a dedicated VPS on RepoCloud with guaranteed CPU, RAM, and SSD, full root SSH access, and a browser serial console. MIT licensed.
Jellydash
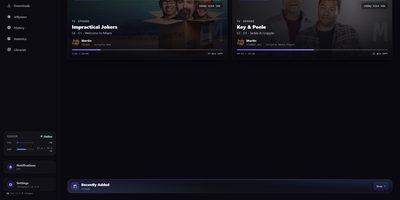
Jellydash answers the questions every Jellyfin admin asks, starting with who is watching right now and whether that stream is transcoding. Live cards show each session's artwork, user, quality, progress, and playback method, including the reason a transcode was needed, and live TV channels appear with real program progress. Behind the scenes, a background poller records every play even when nobody has the dashboard open, building a history you can search, filter by user or library, and export to CSV with poster art intact. Older Jellyfin or Emby Playback Reporting backups import in seconds, so years of viewing are not lost when you switch. Statistics turn that history into watch-time trends, top users, device and client activity, codec breakdowns, and transcode reasons, and clicking a chart opens the exact plays behind it. A monthly recap looks back at a finished month with rankings and daily activity, while trending and all-time most-watched strips show what your household actually loves. Optional pages follow Jellyseerr requests as they arrive and read the status of SABnzbd, qBittorrent, Transmission, Deluge, and NZBGet clients without ever touching their queues. Server activity, maintenance tasks, and system status stay one click away, and selected users can be excluded from monitoring entirely. When someone presses play, a notification can reach your phone through Telegram, Pushover, Discord, ntfy, Gotify, or Web Push. Running on a dedicated VPS on RepoCloud with guaranteed CPU, RAM, and SSD, full root SSH access, and a browser serial console. MIT licensed.
Solectrus
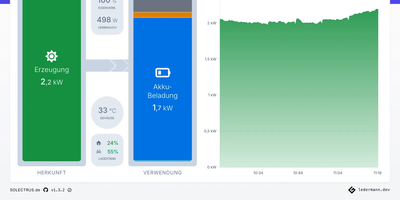
The inverter app tells you the sun shone; SOLECTRUS tells you what that sunshine was worth. It is a dashboard for your whole photovoltaic system that balances every watt: what the panels produced, what the house consumed, what the battery stored, and what crossed the grid meter in either direction, for any period you care to name. Up to five generators, from the main roof array to a balcony power plant, appear individually or summed, and up to twenty custom consumers, wallbox included, get their own accounting. The Power-Splitter shows how much green electricity actually landed in the car, the heat pump, or the washing machine, and what each load truly cost once lost feed-in revenue counts. Enter your electricity prices and feed-in tariff, including their changes over the years, and it computes savings, self-consumption costs, return, and the day the system has paid for itself from measured data rather than the sales brochure. Forecasts from pvnode, Solcast, or Forecast.Solar look up to seven days ahead using your location, orientation, tilt, and peak capacity. Heat pump owners see generated heat and coefficient of performance beside the power draw. Everything lands in InfluxDB and stays there, with daily aggregation keeping multi-year views fast, trends against last month or last year, and a Top-10 of your best and worst days. Running on a dedicated VPS on RepoCloud with guaranteed CPU, RAM, and SSD, full root SSH access, and a browser serial console. AGPL-3.0 licensed.
PayMe
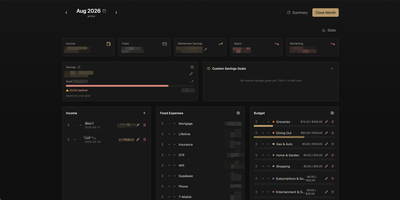
PayMe is a privacy-first personal finance dashboard that runs entirely on your own hardware with zero third-party service dependencies. The Rust backend compiled to a single binary serves a React 19 frontend built with Vite, TypeScript, and Tailwind CSS 4, storing all financial data in a local SQLite database that auto-migrates on startup. Monthly dashboards track income entries, fixed expenses like mortgage and utilities, and budget categories with real-time progress bars showing spending against configurable limits. The savings module includes goal tracking with percentage-based progress indicators, custom savings goals for targeted objectives, retirement savings projections with breakdown analysis, and projected savings calculations. Variance analysis compares actual spending against budgets across categories. Drag-and-drop reordering powered by dnd-kit lets you arrange income sources, expenses, and budget items to match your workflow. The interactive charts rendered by Recharts visualize spending trends, income patterns, and savings trajectories. Month-by-month navigation tracks financial history over time, while the Summary and Stats views aggregate data across periods. JWT-based authentication secures access, and the full OpenAPI Swagger documentation at the /swagger-ui endpoint exposes every API route for automation and integration. Docker Compose deployment creates a minimal image with the compiled Rust binary and static frontend assets, running on port 3001 behind nginx, Caddy, or Traefik reverse proxy with HTTPS. On RepoCloud, deploy PayMe on a dedicated VPS with persistent SQLite storage, root SSH access, and complete privacy over your household financial data, all under the MIT license.
Dashwise
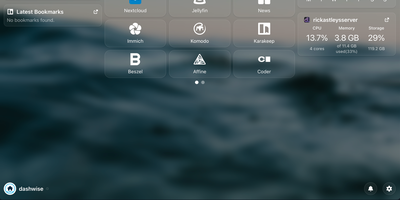
Your homelab grew one service at a time until opening the right one became a memory test, and Dashwise is the dashboard that puts them all in one place. Arrange movable widgets and one-line glanceables around the clock, group links into groups and folders, and build separate pages for the views you actually use. Every piece is configured through the interface itself, so shaping your dashboard never means editing config files by hand. Hit Ctrl+K and the spotlight search jumps you to any link or integration, or fires a search engine bang when the answer lives outside the lab. Subscribe to RSS feeds on the news page to keep up without leaving the dashboard. Other services can push notifications straight into Dashwise, so alerts from your stack land beside the links that fix them. Integrations defined as simple files add widgets, glanceables, and shortcuts for your favorite self-hosted apps, and new ones can be created without touching the core. Accounts are built in, with OIDC single sign-on for households or teams who already run an identity provider. Running on a dedicated VPS on RepoCloud with guaranteed CPU, RAM, and SSD, full root SSH access, and a browser serial console. GPL-3.0 licensed.