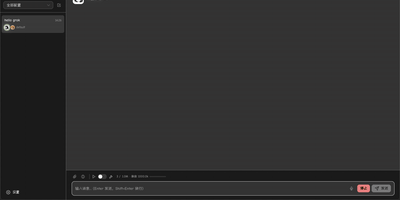
Hermes Studio
The most comprehensive open-source control plane for Hermes Agent — a full workspace combining AI chat, visual workflows, multi-agent orchestration, coding agent management, and platform channel integration in one self-hosted dashboard. Real-time chat streaming over Socket.IO connects to any OpenAI-compatible backend including Ollama, OpenAI, Anthropic, and custom endpoints with multi-session management, tool call expansion, inline file previews for HTML, PDF, DOCX, images, and source code, plus profile-scoped uploads and workspace attachments. The visual workflow builder provides a Vue Flow canvas for constructing DAG-structured pipelines with directed edges, conditional routes, approval gates, loops, and live execution with per-node status updates. Platform channel integration configures Telegram, Discord, Slack, WhatsApp, Matrix, Feishu, DingTalk, QQBot, WeChat, and WeCom bots from one page with credential management and per-platform behavior settings. Multi-agent group chat rooms enable real-time messaging with @mention routing, automatic context compression, and SQLite message persistence. The coding agent panel installs, launches, and monitors Claude Code and Codex with built-in terminal, session history, and file diffs. Usage analytics track token consumption, estimated costs, cache hit rates, and 30-day daily trends with model distribution charts. Kanban boards plan and track agent work alongside cron job scheduling for recurring tasks. Deploy via Docker, npm CLI, or desktop installer for Windows, macOS, and Linux. Running on a dedicated VPS on RepoCloud with guaranteed CPU, RAM, and SSD, full root SSH access, and a browser serial console. MIT licensed.
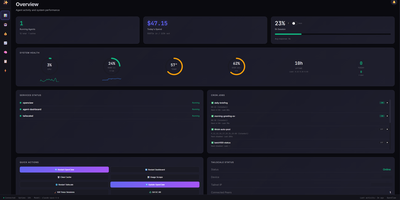
OpenClaw Dashboard
OpenClaw Dashboard is a secure real-time monitoring dashboard for OpenClaw AI agents that tracks live sessions, API costs, rate limits, and host health from one browser page. The overview refreshes every five seconds with live session activity, token totals, and lifetime spending, so you can see what every agent is doing right now. Cost views break spending down by model, session, and time period, and rate limit panels track Claude and Gemini usage against rolling windows with browser alerts before quotas run out. A live feed streams agent messages across all sessions, and a session browser adds search, status filters, timelines, and a 30 day activity heatmap. You can read agent memory files (MEMORY.md, HEARTBEAT.md, daily notes) and edit workspace files, skills, and configuration with JSON validation and automatic backups. Host panels report CPU, memory, disk, and temperature with 24 hour sparklines, plus Docker containers, cron jobs, real-time logs, and one-click service restarts. A security page shows firewall rules, open ports, fail2ban status, and SSH login history, and sign-in uses PBKDF2 hashed passwords with optional TOTP two-factor codes. Running on a dedicated VPS on RepoCloud with guaranteed CPU, RAM, and SSD, full root SSH access, and a browser serial console. MIT licensed.
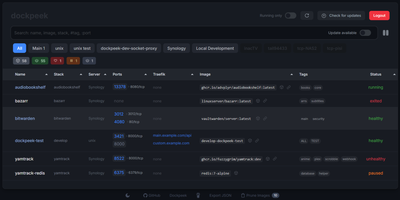
Dockpeek
Fleet-wide container discovery, live log streaming, and Traefik reverse-proxy routing converge into Dockpeek, a lightweight Docker dashboard built for multi-host server environments. System administrators can launch web applications with one click through automatic port binding detection and integrated Traefik label parsing that extracts public routing hostnames directly from container configurations. The platform monitors multi-host environments through encrypted Docker socket proxies, letting operators inspect running containers, query published network ports, and trigger image updates from a unified control panel. Native Docker Swarm integration auto-detects active cluster managers, mapping swarm services and replicated tasks alongside standalone workloads while flagging degraded service replicas. Built-in log inspectors stream stdout and stderr outputs in real time with line-filtering controls to diagnose crashed services without opening remote SSH terminals. Operators can track image registries for newer digest tags, review pending updates across container fleets, and trigger graceful rolling container recreations directly from the dashboard. Running on a dedicated VPS on RepoCloud with guaranteed CPU, RAM, and SSD, full root SSH access, and a browser serial console. MIT licensed.
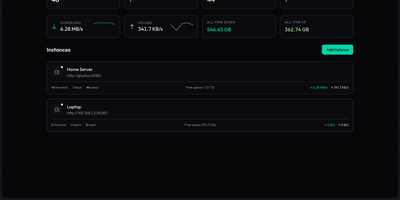
QBitWebUI
QBitWebUI is a single self-hosted dashboard that manages every qBittorrent instance you run, whether that is one seedbox or five, from one place. Instance cards show each client's status, live speeds, and torrent counts, with aggregate statistics across all of them and quick switching between instances. The torrent list brings sortable, resizable columns you can reorder and hide, filters for status, category, tag, and tracker, multi-select bulk actions with a context menu, and a details panel covering trackers, peers, files, and web seeds. Search your Prowlarr indexers from inside the UI and send results straight to the right instance, then let RSS feeds with regex auto-download rules keep recurring releases flowing in unattended. Browse the downloads directory and pull finished files or whole folders as tar archives, run an automatic cross-seed pass to match torrents across trackers, and check the connection with the network agent's speedtest, IP check, and DNS diagnostics. Edit qBittorrent preferences directly from the settings tabs, pick a color theme, and keep working from your phone with the installable PWA and mobile view. Running on a dedicated VPS on RepoCloud with guaranteed CPU, RAM, and SSD, full root SSH access, and a browser serial console. MIT licensed.
Flame
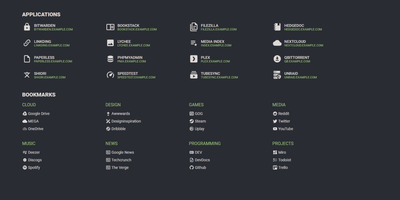
A server full of scattered services becomes one clean application hub under Flame - a self-hosted startpage where every bit of configuration happens in built-in GUI editors, never a config file. Applications and bookmarks are created, edited, and organized into categories directly in the browser, and favorites pin to the homescreen for one-click access. The integrated search bar filters your apps and bookmarks locally as you type, and prefix shortcuts (like /g for Google) route queries to any of 11 web search providers or custom ones you define, making Flame a genuine browser homepage rather than a static link wall. Docker integration is the standout for homelabs: mount the Docker socket, add flame.type, flame.name, and flame.url labels to containers, and new services appear on the dashboard automatically - Kubernetes Ingress annotations work the same way. A weather widget shows temperature, cloud coverage, and animated conditions for your coordinates, and password authentication protects settings and items. Appearance is deeply customizable with 15 built-in color themes, a custom theme builder, and full custom CSS support. The stack is Node.js with SQLite behind a React frontend - light, fast, and inspired by the minimalist SUI design.
DevTrack
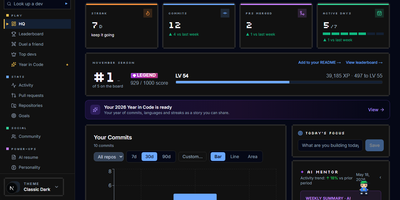
DevTrack turns your GitHub activity into a living dashboard of commit streaks, pull-request analytics, and goals that quietly update themselves. Sign in with GitHub and your last year appears as a contribution heatmap you can filter by repository and language, next to the streak you are protecting and the freeze you are saving for a holiday. Pull requests get the honest treatment: merge rate, average review time, and open-versus-closed breakdowns that show whether reviews or authors are the bottleneck. Weekly and monthly goals fill themselves in from live activity, while the consistency score and activity rings tell you whether your rhythm is steady or heroic but rare. When you want the story told back to you, an AI mentor who knows your history offers guidance, a résumé generator builds an ATS-friendly CV from merged pull requests for the role you name, and a weekly summary explains your own graphs in plain words. Opt into the public leaderboard to rank your streak, commits, and PRs against other developers, or keep everything private and share only the profile page and embeddable badges you choose. Running on a dedicated VPS on RepoCloud with guaranteed CPU, RAM, and SSD, full root SSH access, and a browser serial console. MIT licensed.
Heimdall
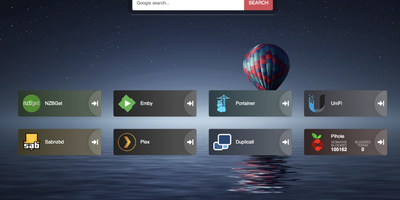
Links stop drowning in browser bookmarks once Heimdall - the application dashboard from the LinuxServer.io team - gives every web app and service you run a single, organized front door. Items come in three tiers. Generic items link to anything on the web with a name, color, and optional icon. Foundation apps are recognized as you type, auto-filling the application's icon and tile color so a full homelab dashboard assembles in minutes. Enhanced apps go further: supply API credentials and the tile shows live data - queue size and download speed for SABnzbd and NZBGet, plus integrations for Sonarr, Radarr, Plex, Jellyfin, Pi-hole, Portainer, Transmission, and many more. There are no iframes and no apps-within-apps; tiles are honest links with real-time stats layered on. Tiles arrange by drag and drop, backgrounds are customizable, an optional search bar (Google, Bing, or DuckDuckGo) makes it work as a browser start page, and optional multi-user authentication keeps dashboards personal. Built on Laravel with SQLite file-based storage - no external database - it stays light, responsive on mobile, and simple to back up. A natural first deployment: the page that ties every other self-hosted service together.
Ghostfolio
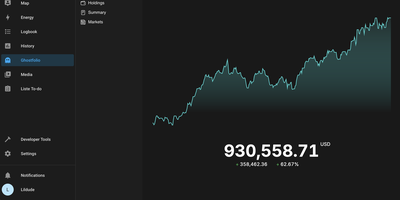
Stocks, ETFs, crypto, bonds, precious metals, and cash across every account and currency, in one privacy-first dashboard: Ghostfolio is open-source wealth management software. The deliberate design decision is no brokerage linking: positions enter by manual entry, CSV import, or the REST API, so your holdings never pass through a data aggregator. Performance is measured as return on average investment across Today, WTD, MTD, YTD, 1Y, 5Y, and Max timeframes, with benchmark comparison against indices like the S&P 500, dividend tracking, and allocation breakdowns by asset class, region, and sector. A static X-ray analysis flags concentration and other portfolio risks, and a FIRE calculator projects progress toward financial independence. Multi-currency support converts holdings using historical exchange rates, market data comes from Yahoo Finance and CoinGecko among other pluggable providers, and everything exports back out as CSV or JSON. Built with Angular and NestJS on PostgreSQL and Redis, shipped as Docker images for amd64 and ARM, with a mobile-first PWA interface, dark mode, and a distraction-free Zen mode. AGPL-licensed.

SQLPage
If you can write a SELECT statement, you can publish a working web app with SQLPage, where each query's results appear on the page as tables, charts, maps, or forms. A .sql file is a page. Name a component in the first row, and the rows after it become lists, cards, data grids, timelines, or step trackers. Tables offer searching, sorting, frozen headers, and per-row edit and delete buttons. Charts cover line, area, bar, pie, scatter, bubble, and heatmap views with a one-click CSV export. Forms feed INSERT and UPDATE statements directly, with validation and file uploads. A complete CRUD tool takes a handful of queries. The map component plots markers and GeoJSON shapes, and the JSON component lets the same data serve other systems as an API. Protect private pages with password logins or single sign-on through Google, Microsoft, or your own identity provider. Connect to SQLite, PostgreSQL, MySQL, SQL Server, or ODBC sources such as DuckDB, Oracle, Snowflake, and BigQuery. Tabs, modals, alerts, breadcrumbs, and carousels shape multi-page sites, and custom templates, CSS, and JavaScript fill any gap. Running on a dedicated VPS on RepoCloud with guaranteed CPU, RAM, and SSD, full root SSH access, and a browser serial console. MIT licensed.
Depictio
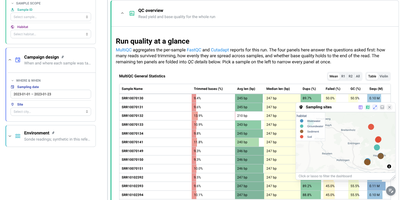
For teams drowning in pipeline output nobody reads, Depictio turns workflow results into dashboards you can hand to a collaborator. A MultiQC tab answers the first questions about a sequencing run: how many reads survived trimming, how evenly they spread across samples, and whether base quality holds to the end of the read, all in one glanceable table. Filter by sample, habitat, site, or sampling date on the left and every panel on the page follows, from community composition cards counting distinct taxa and phyla to differential abundance views that show what was tested, what survives correction, and how large the effects are. Alpha diversity tabs summarise richness and evenness per sample with rarefaction curves, and a sampling sites map lets you click or lasso points to filter the whole dashboard by geography. Forty two ready-made templates cover nf-core pipelines such as ampliseq, atacseq, and airrflow, while outputs from Nextflow, Snakemake, Galaxy, or plain shell scripts feed the same builder. Even a classic tabular dataset becomes an overview of distributions, box plots, and threshold counts, so the same tool serves a wet lab and a data science team. Running on a dedicated VPS on RepoCloud with guaranteed CPU, RAM, and SSD, full root SSH access, and a browser serial console. MIT licensed.
Blocky UI
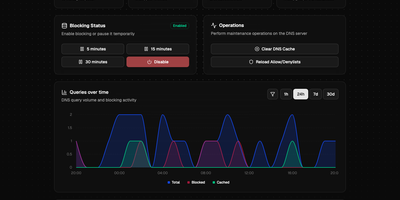
BlockyUI gives your Blocky DNS server a clean browser dashboard for seeing what gets queried, what gets blocked, and how quickly answers come back. Overview cards show total queries, blocked requests, cache hit rate, listed domains, and average response time. Pause blocking for 5, 15, or 30 minutes with one click, or disable it outright, then let it return on its own. Clear the DNS cache and reload allow and deny lists without touching the command line. A queries over time chart switches between 1 hour, 24 hours, 7 days, and 30 days, with filters for a single domain or client. Paginated top lists rank the busiest domains and devices and offer a blocked-only view. The query tool tests how any domain resolves, so a new filtering rule can be checked in seconds. Query logs are searchable and filterable by reason and record type, and they read from MySQL, PostgreSQL, Timescale, SQLite, CSV, or VictoriaLogs. Panels that depend on logging or statistics appear when your Blocky instance supports them, and the dashboard adapts otherwise. Settings live in one YAML file that points at your Blocky server. Running on a dedicated VPS on RepoCloud with guaranteed CPU, RAM, and SSD, full root SSH access, and a browser serial console. MIT licensed.
Claude Code Agent Monitor
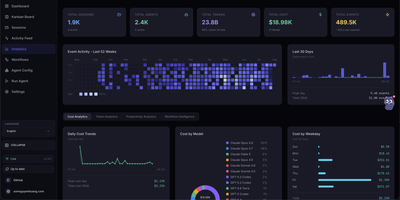
Claude Code Agent Monitor puts every AI coding agent session on one live control room, so you can see what each agent is doing, what it costs, and where it got stuck. Claude Code, Cursor, and Codex sessions land together in a dashboard, a sessions list, an activity feed, and a kanban board. Open any session to read the full rendered conversation with highlighted code, tool calls, command output, and sub-agent timelines. The analytics page charts spend by model and weekday, token totals, cache hit rates, and a 52-week activity heatmap. Workflow views map parent and child agents, delegation, compactions, errors, and concurrency. An Agent Config explorer lists your skills, subagents, slash commands, hooks, plugins, MCP servers, and memory files in one place. The Run Agent page starts a conversation or one-shot job, streams output, and resumes earlier sessions without leaving the browser. Webhook alerts, push notifications, and a REST API keep the rest of your tooling informed. Running on a dedicated VPS on RepoCloud with guaranteed CPU, RAM, and SSD, full root SSH access, and a browser serial console. MIT licensed.
Lowdefy
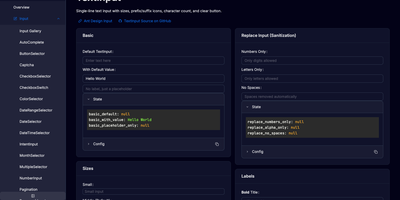
Lowdefy is a config-first web stack that turns YAML files into production web applications, complete with forms, tables, charts, authentication, and live connections to your databases and APIs. You declare pages as trees of blocks (inputs, buttons, tables, charts, markdown), wire events to actions, and the runtime renders a responsive app without a frontend codebase to maintain. More than 50 logic operators handle conditions, lookups, formatting, and state, so dynamic behavior comes from config rather than custom JavaScript scattered across components. Requests run on the server against MongoDB, PostgreSQL, MySQL, REST APIs, Google Sheets, S3, Elasticsearch, and Stripe, keeping credentials off the browser entirely. Sign-in arrives through Auth.js with more than 75 providers, public and private pages, and role-based access control deciding who sees each page and block. When the built-in catalog runs out, npm plugins add custom blocks, connections, operators, actions, and auth providers, declared in the same YAML. Schema validation checks every property before the app serves traffic, and one framework upgrade improves every app built on it. Build once and run the server anywhere Node.js runs, from a single VPS to a container platform. Running on a dedicated VPS on RepoCloud with guaranteed CPU, RAM, and SSD, full root SSH access, and a browser serial console. Apache-2.0 licensed.
Edict
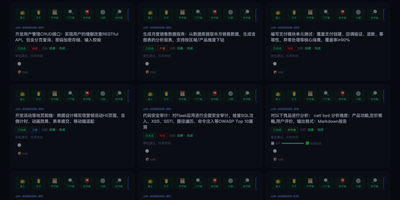
Edict is a multi-agent orchestrator that runs every AI request through a court-style chain: a crown prince agent triages it, a planning department drafts the work, a review department can veto the plan, and specialist ministries execute what survives. Casual chat gets a direct reply, while real commands become kanban tickets whose titles are scrubbed of file paths and metadata. A vetoed plan returns for rework; an approved one is dispatched in parallel to ministries for finance, documentation, engineering, compliance, infrastructure, and HR. Commands arrive through Feishu, Telegram, or Signal channels configured in OpenClaw. The dashboard shows cards by state with heartbeat badges and stop, cancel, and resume controls, plus a department monitor and a memorial archive that turns finished work into five-phase timelines you can copy as Markdown. Nine edict templates add parameter forms and cost estimates, an officials panel ranks agents by merit score while tracking token spend, and per-agent model switching restarts the gateway in about five seconds. Agent thinking, tool calls, and results stream live. A permission matrix limits who may message whom, illegal state jumps are rejected, and every transition lands in an audit log. Worked examples cover competitive analysis, code review, and weekly reports. Dashboard login protects the console, and a systemd unit keeps it running across reboots. Running on a dedicated VPS on RepoCloud with guaranteed CPU, RAM, and SSD, full root SSH access, and a browser serial console. MIT licensed.
LightPost
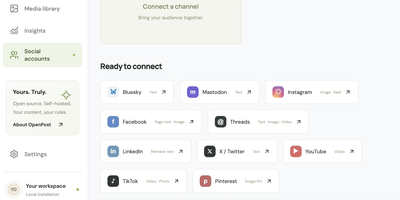
Write a post once in LightPost and it goes out to Bluesky, Mastodon, X, Instagram, Threads, Discord, LinkedIn, Telegram, and Facebook Pages on your schedule, with YouTube video uploads handled in the same workspace, from a dashboard running on your own server. The composer fans one message out to every connected account, including several accounts on the same platform, and each destination can receive text, images, or both within that network's limits. Drafts can be saved, edited, and duplicated, and scheduled times follow your browser's timezone so a week of announcements can be queued in one sitting. Images come in from public JPEG links or a saved library, with alt text and a preview before anything ships. Every delivery is tracked per account with links to the published posts, and when one network fails you retry just that destination instead of blasting the successful ones twice. The queue persists across restarts and overdue posts resume on their own, so an overnight reboot never eats a scheduled campaign. Built-in setup guides walk you through eligibility, credentials, and permissions for each platform, account connections can be verified or reconnected from the same panel, and your credentials stay encrypted on your disk with optional password protection and exportable post history. Running on a dedicated VPS on RepoCloud with guaranteed CPU, RAM, and SSD, full root SSH access, and a browser serial console. MIT licensed.
Liwan
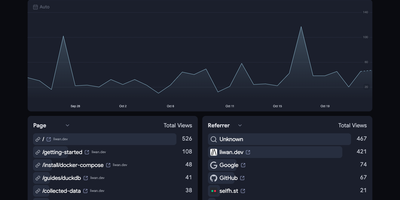
When you want honest traffic numbers without tracking cookies or stored IP addresses, Liwan puts a real-time analytics dashboard on your own server. The dashboard ranks pages, referrers, countries, browsers, platforms, and devices, charts visitors over time, and filters out bot traffic by default. Session metrics add bounce rate, average time on site, and entry and exit pages, while UTM fields attribute visits to campaigns. Collection is adjustable globally and per site: choose how visitors are grouped, whether to store country and city, country only, or no location, and how long events are kept. Drop rules discard internal, test, and local traffic before storage, and a pruning tool applies new settings to history after a dry-run preview. Tracking is one line of HTML, or your own server can send events with custom names and properties. Location can come from a MaxMind database or from Cloudflare, Vercel, and other proxy headers. One instance holds several projects and sites, with team accounts and single sign-on through Google Workspace, Microsoft Entra ID, or an OpenID Connect provider such as Keycloak or Dex. Running on a dedicated VPS on RepoCloud with guaranteed CPU, RAM, and SSD, full root SSH access, and a browser serial console. Apache-2.0 licensed.
GammaGrid
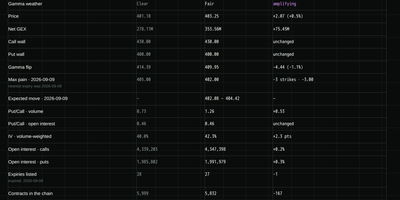
Dealer gamma exposure, max pain, open interest, and the full IV surface for an entire options watchlist land in one self-hosted dashboard that keeps every snapshot it collects. Add any US-listed ticker, press Collect data, and a banner above every view states net GEX, call and put walls, the gamma flip, and a plain-language regime label. The GEX heatmap lays out strike by expiry with historical replay, and the Changes tab compares two trading days side by side. A Contract view splits one option's price move into delta, gamma, vega, theta, and an honest residual. The screener lists every contract with seven greeks and range filters, unusual activity flags volume outliers against each contract's own history, and OI Delta ranks the biggest overnight position changes. Collection can run automatically from every 15 minutes to once a day, and it sleeps through closed markets to save disk space. The 3D volatility surface and skew slices show how implied volatility is priced across the chain. Running on a dedicated VPS on RepoCloud with guaranteed CPU, RAM, and SSD, full root SSH access, and a browser serial console. AGPL-3.0 licensed.
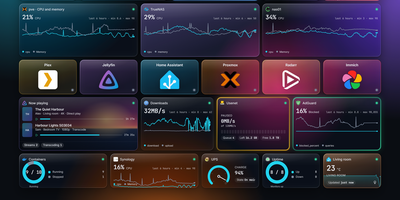
nexdeck
Every homelab ends up with twenty browser tabs, and nexdeck turns them into one board of cards that update on their own. The server asks each service in its own rhythm and pushes changes to every open browser, so ten tabs cost a service only one request. Cards cover Proxmox, Docker, Synology, TrueNAS, Pi-hole, Plex, Radarr, Home Assistant, and over two hundred more. Administrators can act from the cards by restarting a container, starting a VM, or pausing downloads, and every action is logged. Pages arrange freely on a 12, 24, or 36 column grid, with a phone layout that stacks cards in order and a kiosk link for wall displays that needs no sign-in. A network page draws a live UniFi plan with traffic on every link. A chronicle records outages and changes, history charts reach back two years, and alerts go to Telegram, email, Web Push, ntfy, Gotify, Discord, Slack, or Apprise. Boards export as YAML for Git, Docker labels create tiles, and OpenID Connect handles sign-in with roles and board sharing. Thirteen colour themes, light and dark modes, skins, and twelve languages make it yours. A demo board with invented data offers a safe first look. Running on a dedicated VPS on RepoCloud with guaranteed CPU, RAM, and SSD, full root SSH access, and a browser serial console. AGPL-3.0 licensed.