Categories
Self-Hosted Analytics Dashboard Finance Data Visualization Investing Market Data Options TradingStars
Forks
Watchers
Developer links
GammaGrid
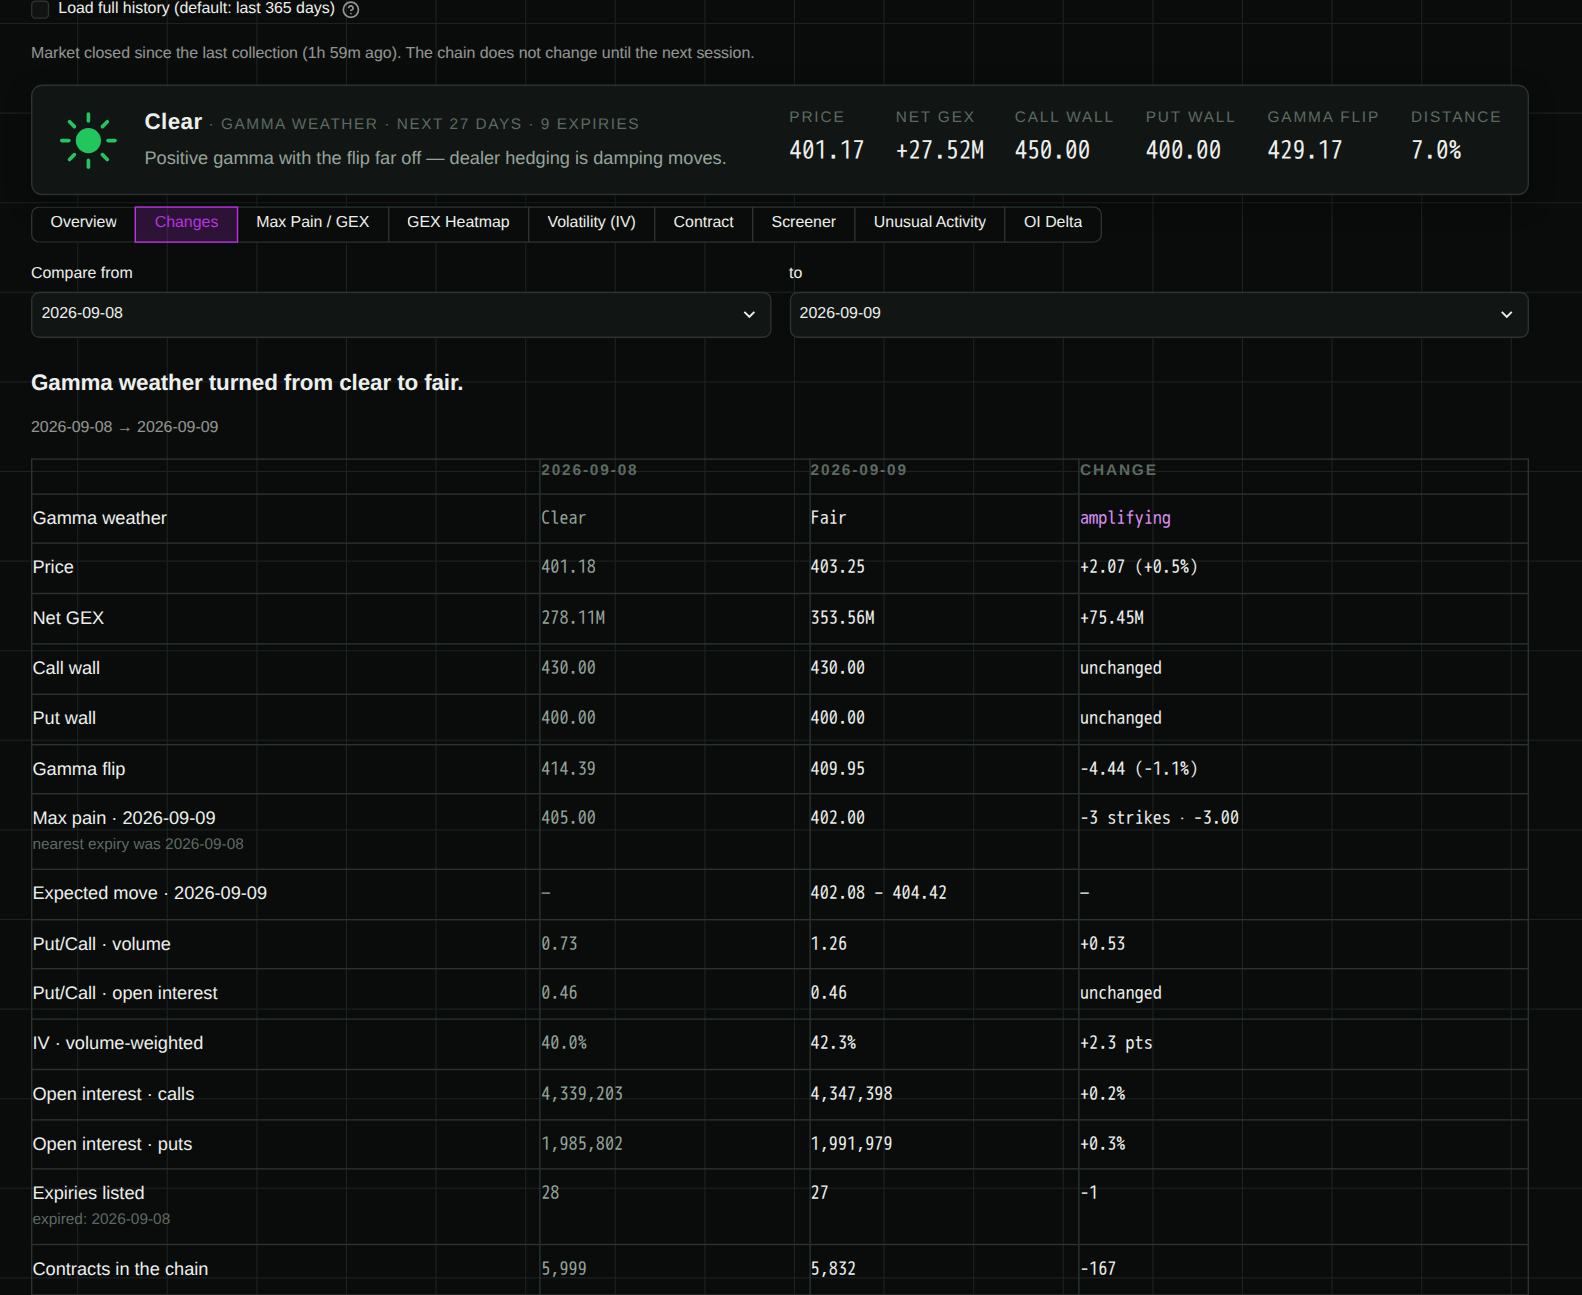
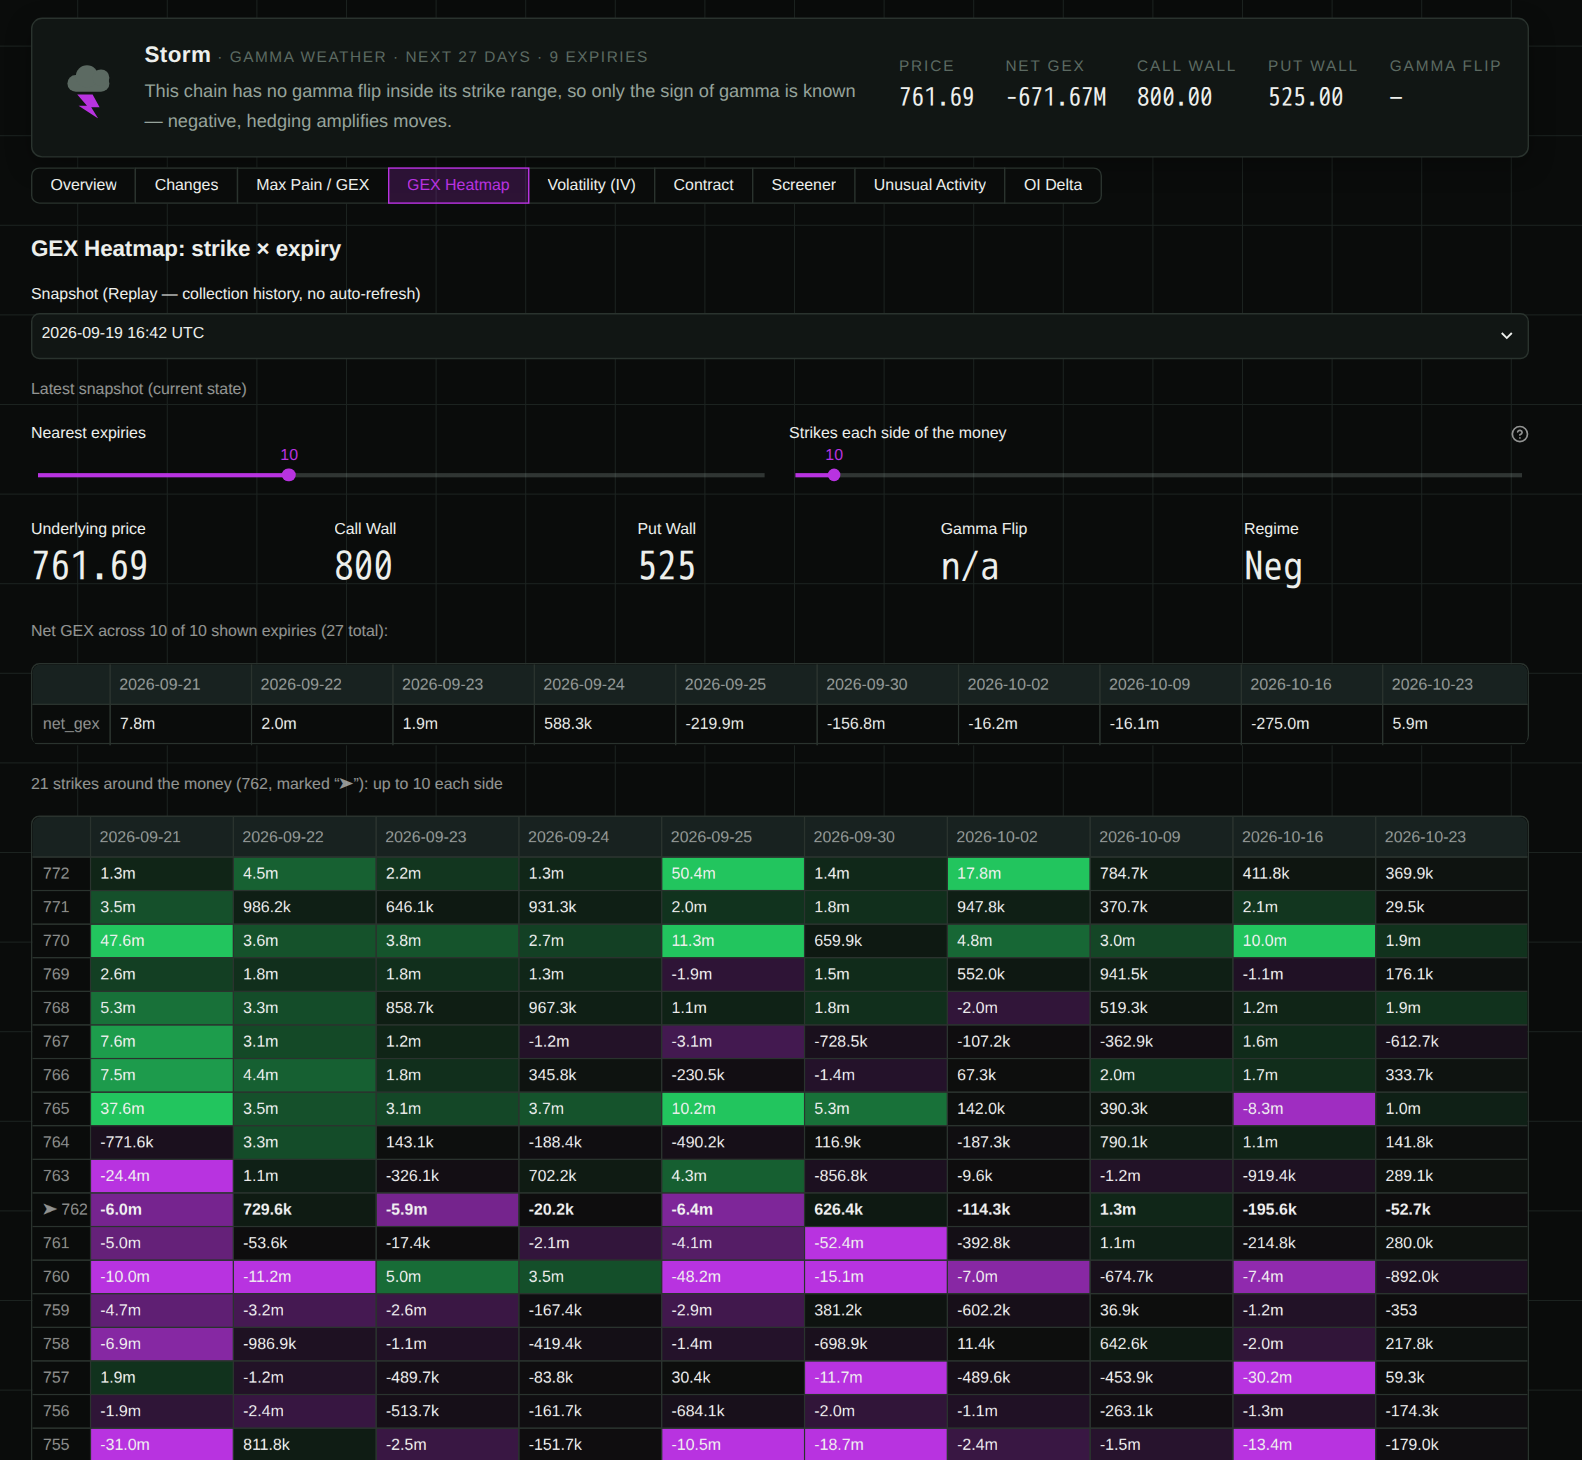
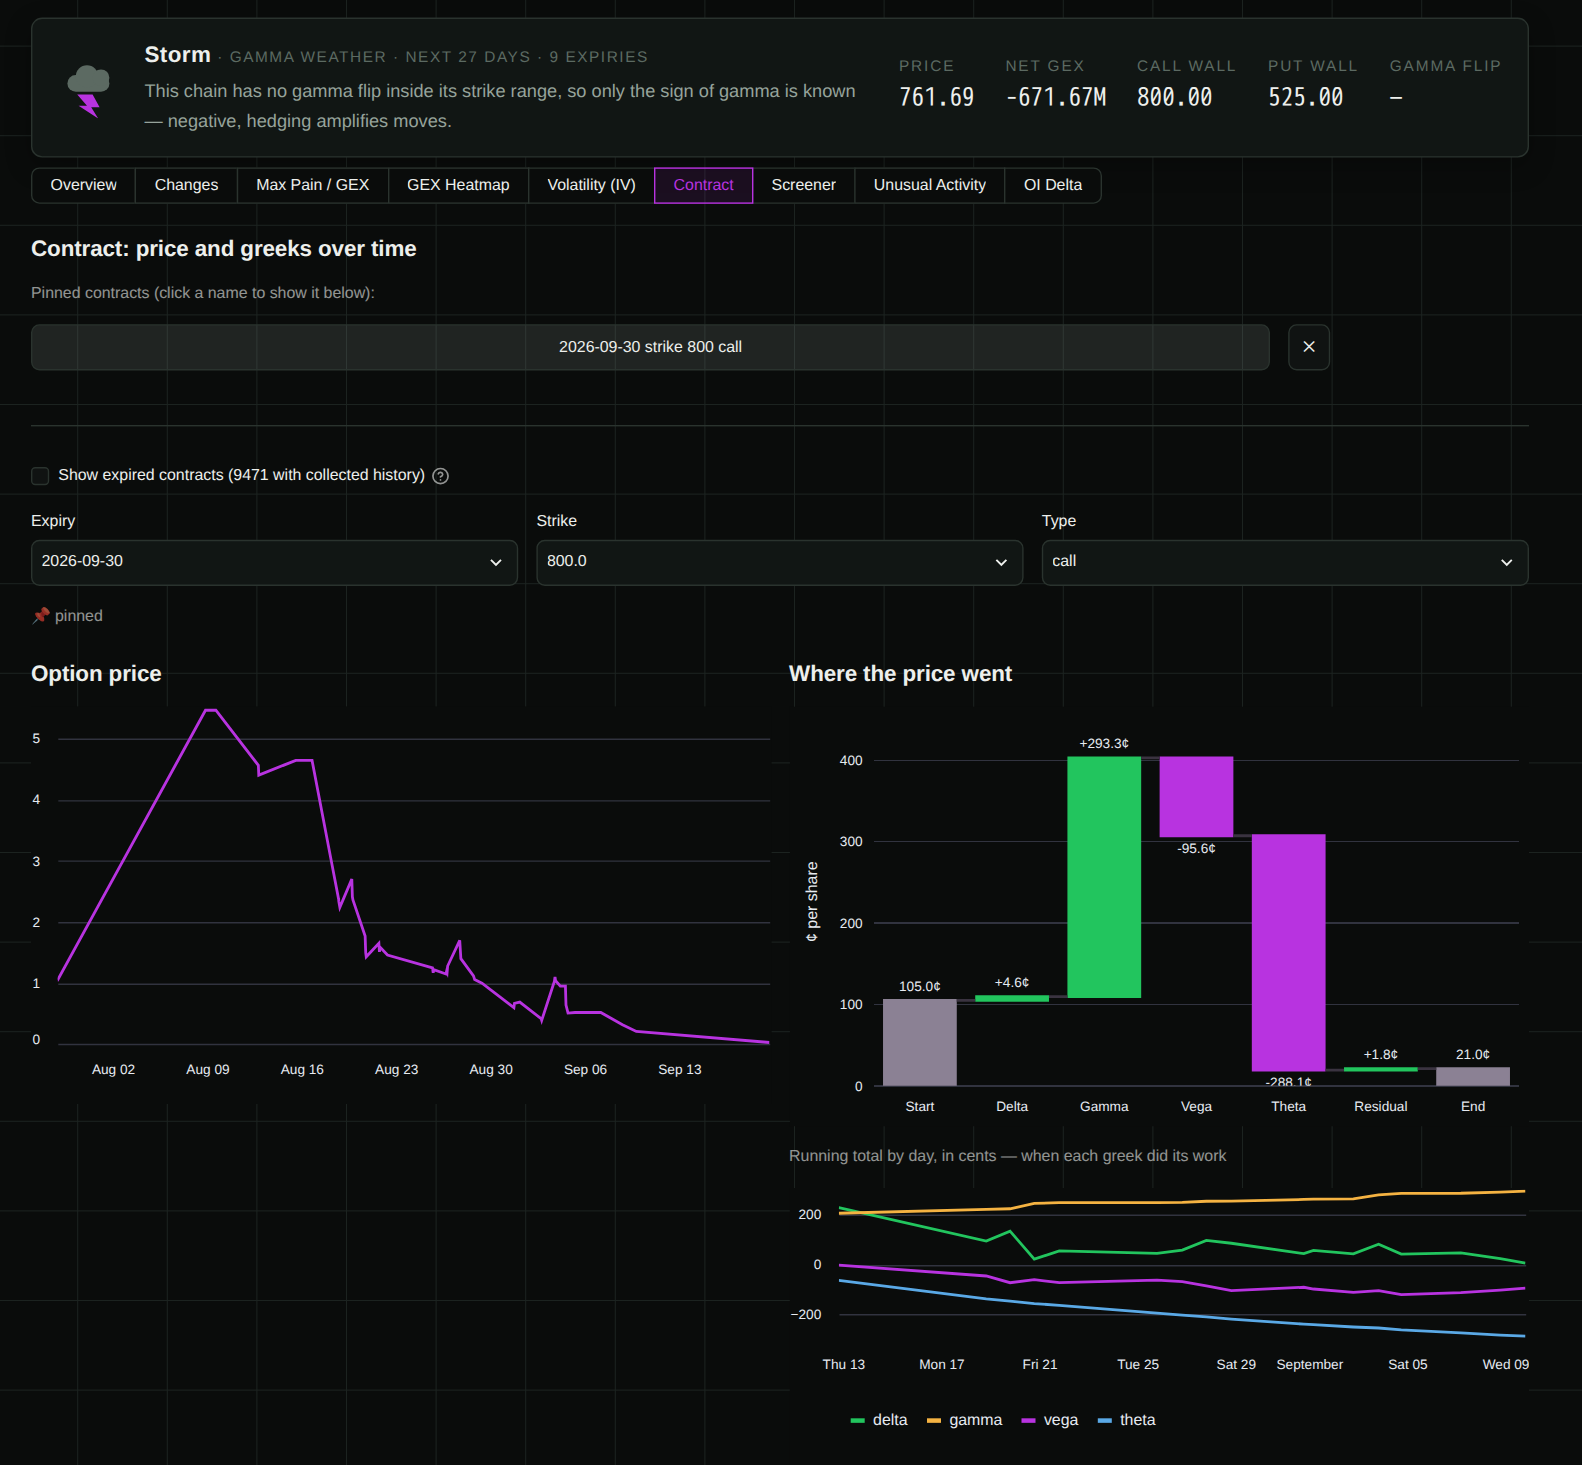
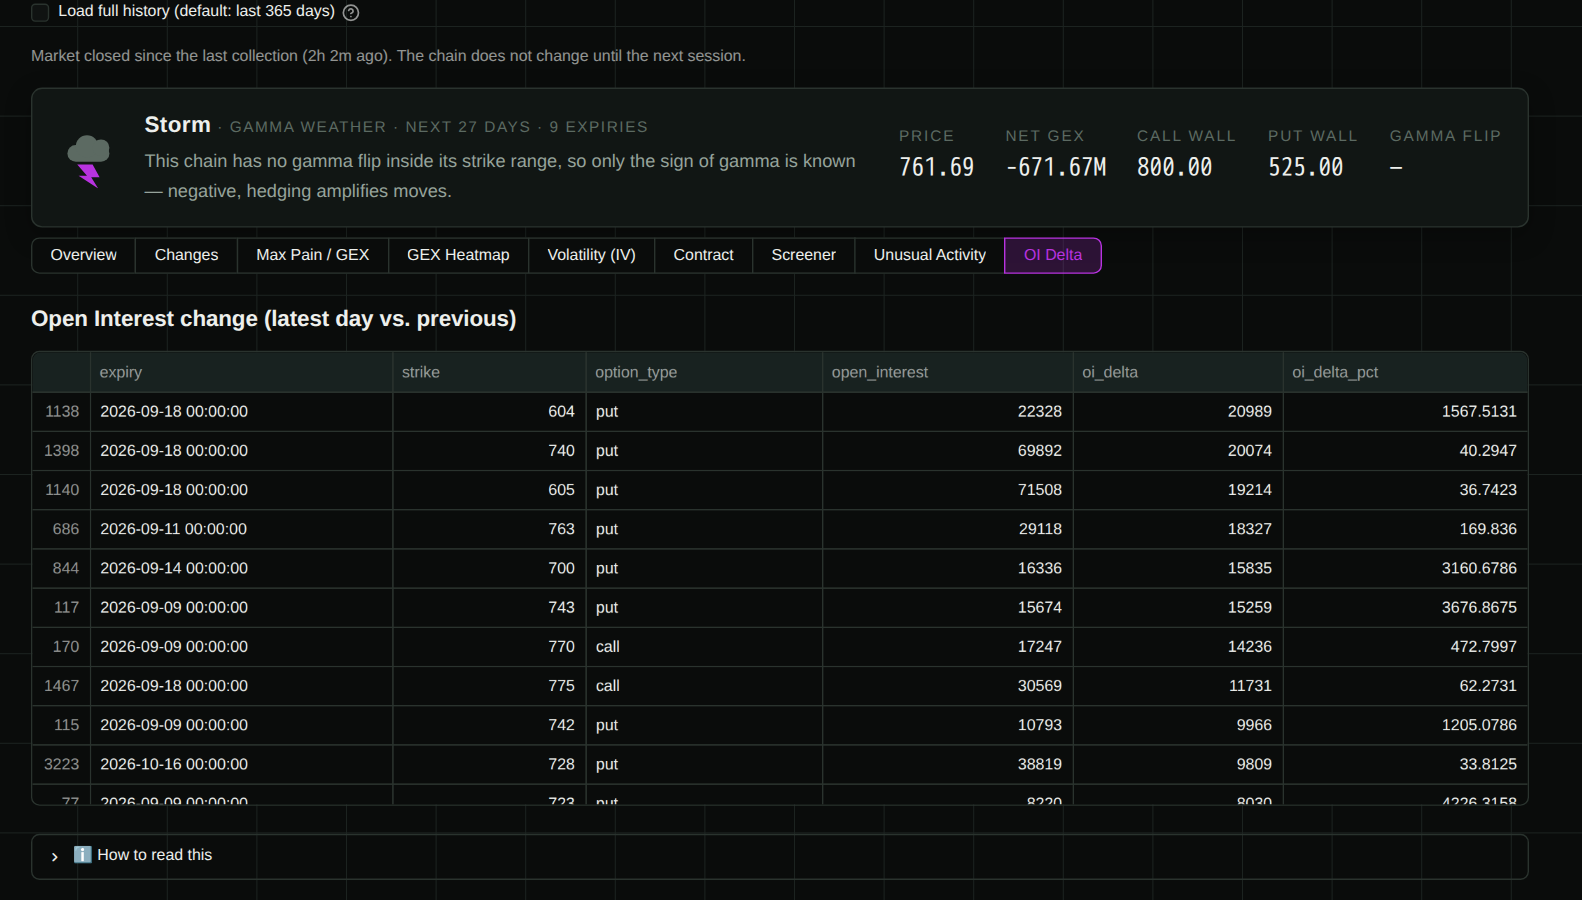
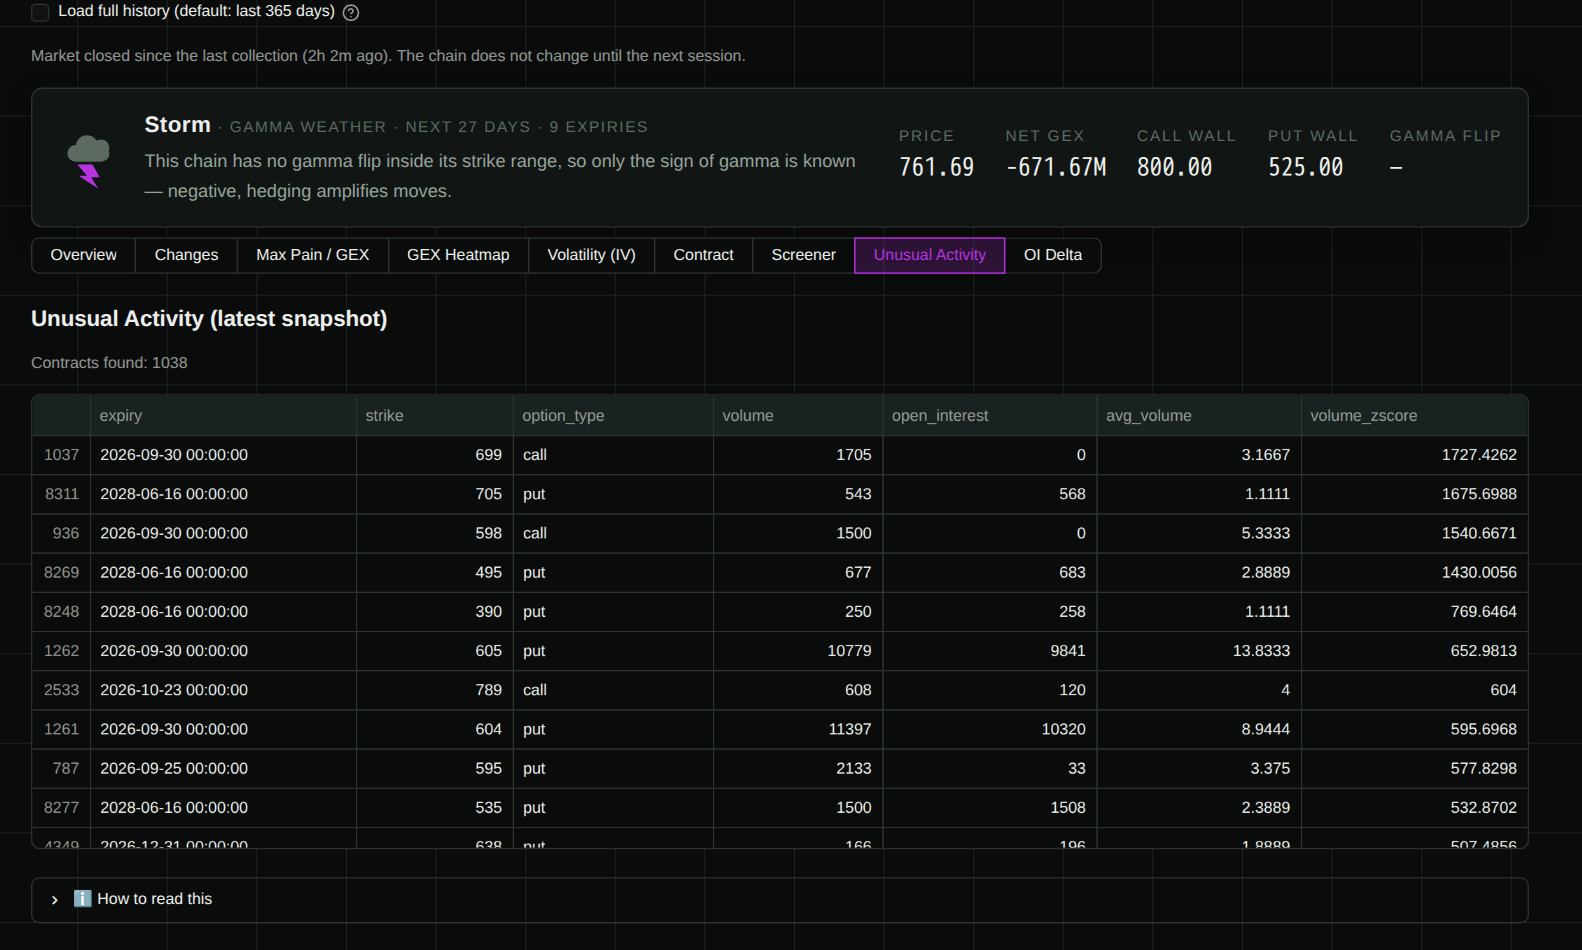
Dealer gamma exposure, max pain, open interest, and the full IV surface for an entire options watchlist land in one self-hosted dashboard that keeps every snapshot it collects. Add any US-listed ticker, press Collect data, and a banner above every view states net GEX, call and put walls, the gamma flip, and a plain-language regime label. The GEX heatmap lays out strike by expiry with historical replay, and the Changes tab compares two trading days side by side. A Contract view splits one option's price move into delta, gamma, vega, theta, and an honest residual. The screener lists every contract with seven greeks and range filters, unusual activity flags volume outliers against each contract's own history, and OI Delta ranks the biggest overnight position changes. Collection can run automatically from every 15 minutes to once a day, and it sleeps through closed markets to save disk space. The 3D volatility surface and skew slices show how implied volatility is priced across the chain. Running on a dedicated VPS on RepoCloud with guaranteed CPU, RAM, and SSD, full root SSH access, and a browser serial console. AGPL-3.0 licensed.
Benefits
- History Nobody Else Keeps
- Every snapshot is stored in your own PostgreSQL database, so you can look back at what the gamma profile was at a given hour last week.
- Any US Options Ticker
- Build a watchlist of stocks and ETFs with listed US options, with a searchable symbol directory that explains why a symbol cannot be collected.
- Plain-Language Market Regime
- A banner on every view summarizes net GEX, the walls, and the gamma flip, and states if dealer hedging is damping or amplifying moves.
- No Account Or Paid Feed
- Option chains come from a free public data source, automatic collection is off until you turn it on, and your watchlist and history stay on your own server.
Features
- GEX Heatmap And Replay
- See dealer gamma by strike and expiry with call wall, put wall, and gamma flip marked, then step back through every collected moment.
- Day Over Day Changes
- Compare two trading days for price, net GEX, walls, max pain, expected move, put and call ratios, volatility, and open interest on one page.
- Contract Greeks History
- Pin a contract to chart its price, implied volatility, and greeks, with a waterfall that splits its price move into delta, gamma, vega, and theta.
- Screener And Unusual Activity
- Filter every contract by greeks and ranges, and spot volume that is a statistical outlier against that contract's own history.
- Open Interest Delta
- Rank strikes by the overnight change in open interest, from the largest move down, to see where positions were opened or closed.
- 3D Volatility Surface
- Explore implied volatility across strikes and expiries in a rotatable surface, with per-expiry skew slices and volume-weighted average IV over time.