DooTask
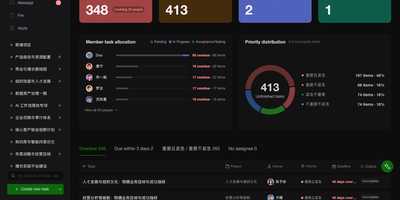
Open a project in DooTask and your tasks appear as a Kanban board, a list, a Gantt timeline, or a calendar, with team chat and file sharing beside them. Start from a project or task template and set a task to repeat so each new occurrence links back to the original. Mention colleagues in project and task chats, add emoji, and keep messages protected with asymmetric encryption. Files from chats and tasks gather in a Collaboration Files section, and WebDAV lets you manage My Files and Shared Files from Finder or Explorer. Check the dashboard for what is overdue, due today, or coming up, while department heads switch to a team view charting overdue and incomplete tasks per member. Visit the App Store to install official apps for approvals, OKRs, AI assistants, OnlyOffice, Minder mind maps, and Drawio diagrams. Administrators can add custom apps from an archive, a URL, or a GitHub repository. Add an API key for ChatGPT, Claude, Gemini, DeepSeek, or Grok, or point to Ollama or any OpenAI-compatible URL, then type @AI Robot in a project chat to draft tasks. Log in on the web by scanning a QR code with the mobile app, or use an LDAP or Active Directory username. The free Open Source Edition covers three users; paid editions raise that to ten or unlimited. Running on a dedicated VPS on RepoCloud with guaranteed CPU, RAM, and SSD, full root SSH access, and a browser serial console. AGPL-3.0 licensed.
Chartbrew
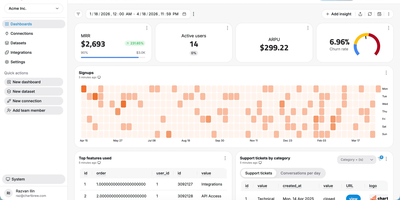
Chartbrew transforms raw database queries and API responses into polished, shareable dashboards without requiring a data engineering team. Connect to MySQL, PostgreSQL, MongoDB, Firestore, or any REST API, then build datasets using the visual query editor with syntax highlighting and auto-completion. Charts render through Chart.js with line, bar, pie, donut, radar, polar, KPI card, and table visualizations, each customizable with colors, legends, filters, and goal indicators. An AI assistant accelerates dashboard creation by generating queries and suggesting chart configurations from natural language descriptions of the metrics you want to track. Reusable datasets let teams prepare data transformations once and share them across multiple charts, while automatic scheduling through BullMQ and Redis refreshes data at intervals from every 10 minutes to monthly. The embed feature generates standalone chart URLs for insertion into external websites, internal tools, or customer portals, and the Reporting API enables programmatic dashboard management and automated report delivery. Team workspaces with role-based permissions control who can view, edit, or manage data connections. Nearly 4,000 GitHub stars reflect steady community adoption. The platform runs on Node.js with Express and Sequelize ORM, supporting MySQL or PostgreSQL as its application database. Running on a dedicated VPS on RepoCloud with guaranteed CPU, RAM, and SSD, full root SSH access, and a browser serial console. FSL-1.1-MIT licensed (converts to MIT two years after each release).