Laminar
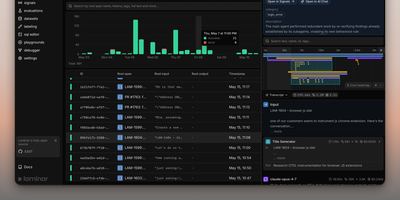
Backed by Y Combinator (S24) and processing traces from thousands of AI agents in production, Laminar is the open-source observability platform that treats agent debugging as a first-class engineering discipline rather than an afterthought. Its OpenTelemetry-native SDK auto-instruments Vercel AI SDK, LangChain, OpenAI, Anthropic, Gemini, Browser Use, Stagehand, Mastra, Pydantic AI, and the OpenAI Agents SDK with a single line of code, capturing every LLM turn, tool call, and sub-agent delegation as nested spans with full input/output data and token costs. The Signals engine lets you describe failures in plain language — "agent is stuck in a loop" or "tool returned empty results" — then reads every trace and alerts via Slack when it detects a match. A built-in debugger records runs and replays them from cache so each iteration takes seconds, designed for Claude Code, Cursor, or Codex to drive the repair loop via the MCP server or CLI. Run code-first evaluations in Python or TypeScript locally or in CI/CD pipelines, build datasets from production traces, and query everything with raw SQL through custom dashboards, the in-app editor, or your coding agent. The Rust backend delivers 20x trace compression, a custom real-time streaming engine, ultra-fast full-text search, and gRPC ingestion, while ClickHouse powers columnar analytics and PostgreSQL stores application state. Running on a dedicated VPS on RepoCloud with guaranteed CPU, RAM, and SSD, full root SSH access, and a browser serial console. Apache 2.0 licensed.
Ghostfolio
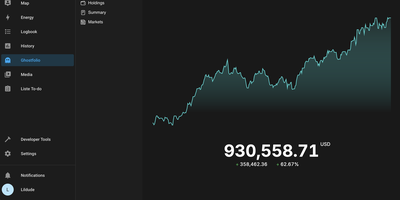
Stocks, ETFs, crypto, bonds, precious metals, and cash across every account and currency, in one privacy-first dashboard: Ghostfolio is open-source wealth management software. The deliberate design decision is no brokerage linking: positions enter by manual entry, CSV import, or the REST API, so your holdings never pass through a data aggregator. Performance is measured as return on average investment across Today, WTD, MTD, YTD, 1Y, 5Y, and Max timeframes, with benchmark comparison against indices like the S&P 500, dividend tracking, and allocation breakdowns by asset class, region, and sector. A static X-ray analysis flags concentration and other portfolio risks, and a FIRE calculator projects progress toward financial independence. Multi-currency support converts holdings using historical exchange rates, market data comes from Yahoo Finance and CoinGecko among other pluggable providers, and everything exports back out as CSV or JSON. Built with Angular and NestJS on PostgreSQL and Redis, shipped as Docker images for amd64 and ARM, with a mobile-first PWA interface, dark mode, and a distraction-free Zen mode. AGPL-licensed.
HitKeep
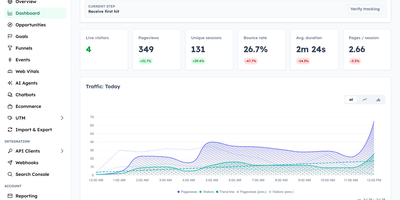
HitKeep is a sovereign web analytics platform that consolidates cookieless visitor telemetry, conversion funnels, e-commerce revenue reports, and AI engine visibility into a privacy-respecting dashboard that replaces Google Analytics and complex tracking clouds. Marketing teams can monitor inbound visitor journeys without installing intrusive consent banners or violating regional GDPR regulations. Custom conversion funnels and goal milestones track user registrations, checkout transactions, newsletter subscriptions, and software downloads with exact revenue attribution. Integrated Google Search Console synchronization brings organic search queries, keyword impression rankings, and click-through metrics directly alongside real-time pageview logs. A dedicated artificial intelligence visibility dashboard monitors crawling bots, retrieval citations, and direct referral visits originating from ChatGPT, Claude, Perplexity, and other generative search agents. Growth analysts can pose natural language questions to an embedded AI reporting assistant, generating instant cohort breakdowns and engagement trends without assembling complex manual filters. Site operators can configure custom tracking domains, whitelist reverse proxy networks, filter out referrer spam, and schedule automated database backups across persistent storage volumes. Complete data sovereignty controls allow teams to export raw event telemetry into open Parquet and CSV archives or stream metrics into external business intelligence warehouses via webhooks. Running on a dedicated VPS on RepoCloud with guaranteed CPU, RAM, and SSD, full root SSH access, and a browser serial console. MIT licensed.
GoAccess
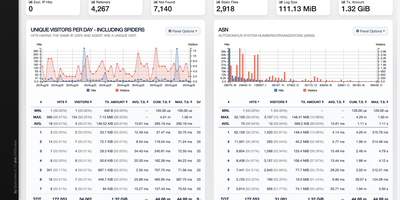
GoAccess processes millions of web log entries in seconds and renders the results as interactive dashboards that update every 200 milliseconds in the terminal or every second via WebSocket-connected HTML reports. Written entirely in C with only ncurses as a dependency, it achieves exceptional performance even on resource-constrained servers, reducing memory usage by approximately 20% and parsing time by 35% in recent releases through optimized in-memory hash tables with on-disk persistence support. The analyzer parses virtually every web log format out of the box (Apache Combined and Common, Nginx, Amazon CloudFront, Amazon S3, AWS Elastic Load Balancing, Google Cloud Storage, Squid, W3C IIS, Caddy JSON, and Traefik) while supporting fully custom log format strings for non-standard configurations. The self-contained HTML dashboard displays 15+ interactive panels covering unique visitors, requested files, static files, 404 errors, referring sites, search keyphrases, geographic location with city-level GeoIP resolution, operating systems, browsers, HTTP status codes, time distribution, and virtual host metrics. WebSocket authentication via JWT provides secure remote access, and incremental log processing ensures data continuity across daemon restarts. Docker deployment requires a single command with volume-mapped access logs. Over 20,800 stars with active development since 2010. Running on a dedicated VPS on RepoCloud with guaranteed CPU, RAM, and SSD, full root SSH access, and a browser serial console. MIT licensed.
OpenLIT
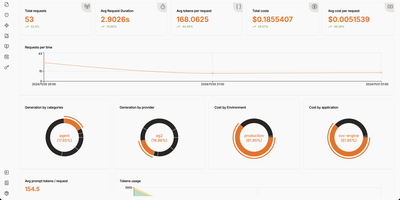
Your AI application is burning through API tokens faster than you can refresh the billing page, and you have no idea which prompt template is responsible. OpenLIT plugs that visibility gap with a self-hosted observability platform built specifically for LLM workloads. Add one line of code to instrument 90+ LLM providers, agent frameworks, and vector databases, then watch every request flow through a tracing dashboard that shows tokens consumed, latency measured, and dollars spent per call, per model, per environment. The requests view lists every LLM interaction with provider, model, cost, and token breakdown in a filterable table, while the trace detail panel lets you drill into individual spans to read the exact prompt sent and response received. Prompt Hub turns prompts into versioned artifacts you deploy, rollback, and A/B test without touching application code. OpenGround compares models side by side on the same input, so you can evaluate cost-versus-quality tradeoffs before committing to a provider. Automated evaluations run LLM-as-a-judge scoring on live production traces, flagging hallucinations, bias, and toxicity in real time. The Vault stores and rotates API keys centrally so secrets stay out of your codebase. Custom dashboards let you build drag-and-drop monitoring views with charts, stat cards, and tables backed by SQL queries against ClickHouse. GPU utilization, memory, temperature, and power metrics feed into the same platform for end-to-end infrastructure visibility. Running on a dedicated VPS on RepoCloud with guaranteed CPU, RAM, and SSD, full root SSH access, and a browser serial console. Apache 2.0 licensed.
Shlink
With over 5,100 GitHub stars and eight years of active development since 2016, Shlink has become the definitive self-hosted URL shortener for teams that need unlimited links, full visitor analytics, and complete data ownership without per-link pricing or monthly caps. The PHP backend built on the Mezzio framework with Doctrine ORM serves redirects through any number of custom domains on a single instance, generating unique short codes or accepting custom slugs including multi-segment paths and emoji characters. Every click is tracked with anonymized visitor data including geolocation by country, city, and coordinates, browser and operating system identification, referrer source, and device type classification, all stored in your choice of MySQL, MariaDB, PostgreSQL, Microsoft SQL Server, or SQLite. Dynamic redirect rules route visitors to different destinations based on geolocation, device type, or browser language, enabling targeted campaigns from a single short URL. The REST API exposes every operation with OpenAPI documentation and an interactive sandbox at api-spec.shlink.io, while the CLI provides equivalent functionality for scripting and automation. The official progressive web app at app.shlink.io manages multiple Shlink instances from a single interface with URL creation, tag management, and detailed visit charts. Real-time event integration supports both Mercure and RabbitMQ for webhook-style notifications on new visits. Third-party imports migrate existing short URLs from Bitly and YOURLS with visit history preserved. Running on a dedicated VPS on RepoCloud with guaranteed CPU, RAM, and SSD, full root SSH access, and a browser serial console. MIT licensed.
OpenSearch
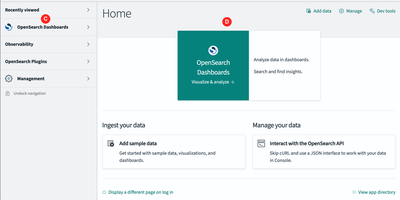
OpenSearch is a search and analytics platforms, powering full-text search, log analytics, observability, and AI-powered vector retrieval at petabyte scale. The distributed engine provides BM25 full-text search alongside k-NN vector search using NMSLIB, Faiss, and Lucene libraries, enabling semantic search, hybrid search combining keyword and vector scoring through normalization processors, neural sparse search, and retrieval-augmented generation workflows with built-in ML Commons for model hosting. OpenSearch Dashboards delivers interactive visualization with Discover for log exploration, custom dashboards, alerting, anomaly detection using Random Cut Forest algorithms, and Security Analytics with detection rules mapped to MITRE ATT&CK. Native Prometheus integration with full PromQL support unifies metrics alongside logs and traces in a single observability interface, while Data Prepper handles telemetry ingestion from OpenTelemetry collectors, Fluent Bit, and Logstash-compatible pipelines. SQL and Piped Processing Language queries with a visual PPL builder enable analysts to query data without learning the native DSL. Index State Management automates index lifecycle with rollover, shrink, and delete policies, while cross-cluster replication and searchable snapshots on S3-compatible storage provide disaster recovery. Scoped API keys, field-level security, document-level security, and audit logging deliver enterprise-grade access control. Docker Compose deploys multi-node clusters alongside the Kubernetes operator for orchestrated production environments. Running on a dedicated VPS on RepoCloud with guaranteed CPU, RAM, and SSD, full root SSH access, and a browser serial console. Apache 2.0 licensed.
Unkey
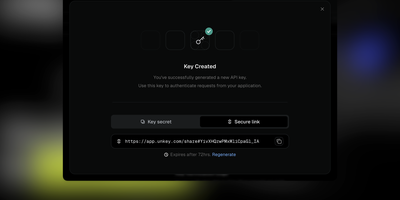
Unkey is the open-source platform that unifies API key management, rate limiting, deployment, and observability into a single control plane. The Go API service validates keys with sub-millisecond latency using regional Redis caches and MySQL 8.0 persistent storage, while ClickHouse captures every verification event for per-key and per-keyspace analytics with filterable time-series charts, request counters, and active key tracking. Keyspaces organize API keys by product, environment, or tier, each configurable with custom prefixes, byte lengths, IP whitelists, encrypted key recovery, and delete protection. Per-key settings include expiration dates, rate limit quotas with configurable windows, RBAC roles and permissions, owner identities linking multiple keys to a single user or organization, and key rotation with grace periods from immediate revocation through 24-hour overlap. The deployment pipeline connects GitHub repositories for automatic Docker container builds, generates preview environments per commit, promotes tested versions to production, and validates releases with OpenAPI diff detection flagging breaking changes before production. The edge gateway authenticates and rate-limits requests at the closest region before routing to the nearest API instance. Immutable audit logs track every key creation, verification, deletion, and configuration change with actor, timestamp, and event metadata. The CLI provides terminal access to key management, analytics queries, and deployment operations. On RepoCloud, deploy Unkey on a dedicated VPS with Docker, root SSH access, and complete control over your API infrastructure, all under the AGPL license.
Manticore Search
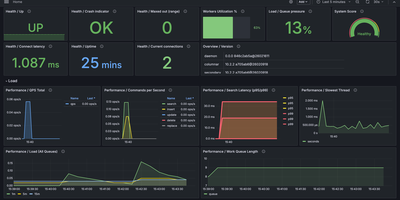
With nearly 12,000 GitHub stars and a lineage tracing back to Sphinx Search, Manticore Search is the C++ search database that delivers the full-text, vector, and hybrid search capabilities of Elasticsearch at a fraction of the resource cost — starting in under a second and consuming just 40MB RAM for an empty instance. The SQL-first interface speaks the MySQL wire protocol, meaning mysql client, MySQL Workbench, and any MySQL-compatible driver connects natively without adapters, while the HTTP JSON API provides RESTful access for modern applications. Over 20 full-text operators handle proximity search, quorum matching, field-start and field-end constraints, MAYBE operators, and regex patterns, backed by stemming, lemmatization, stopwords, synonyms, wordforms, and advanced morphology in 70+ languages. Vector search with HNSW indexing enables semantic similarity queries, and hybrid mode combines keyword relevance with vector distance in a single ranked result set using a cost-based query optimizer. Real-time indexing delivers sub-second document availability after insert, sharded tables distribute data across nodes, and Galera-based synchronous replication ensures high availability. Conversational search via CREATE CHAT MODEL and CALL CHAT integrates LLM-backed responses with KNN retrieval and conversation history directly inside the database. Client libraries ship for PHP, Python, JavaScript, TypeScript, Java, Go, Rust, and Elixir. Columnar storage via the Manticore Columnar Library handles analytical workloads on large datasets. Running on a dedicated VPS on RepoCloud with guaranteed CPU, RAM, and SSD, full root SSH access, and a browser serial console. GPLv3 licensed.
Papermark
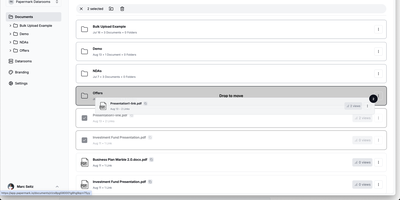
With nearly 9,000 GitHub stars and adoption by over 60,000 companies across 100 countries, Papermark is the open-source DocSend alternative that turns document sharing into a data-rich conversation between you and your viewers. Every shared document generates page-by-page analytics showing exactly which pages capture attention, how long viewers spend on each section, where they drop off, and whether they return for a second look, with real-time notifications the moment a document is opened. Virtual data rooms support unlimited folders with drag-and-drop organization, bulk uploads, granular per-viewer permissions, dynamic watermarking that stamps each page with the viewer's identity, and NDA gating that requires agreement before access. Custom branding applies your logo, colors, and custom domain to every shared link and download page, while email verification and password protection add authentication layers. The AI Data Room Copilot lets viewers chat with uploaded documents, ask questions, and receive contextual summaries directly within the data room interface. The developer platform exposes 43 REST API operations covering data rooms, documents, folders, links, visitors, and analytics, with an MCP server for AI agent integration and a CLI for automation. Built on Next.js with TypeScript, Prisma ORM, PostgreSQL, NextAuth.js authentication, and shadcn/ui components. Running on a dedicated VPS on RepoCloud with guaranteed CPU, RAM, and SSD, full root SSH access, and a browser serial console. AGPLv3 licensed.
Briefer
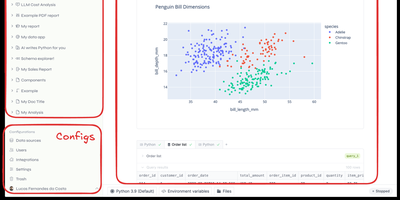
Backed by Y Combinator with 4,300 GitHub stars and growing rapidly since its September 2024 launch, Briefer delivers the first truly unified notebook-and-dashboard platform that eliminates the fragmented workflow of juggling Jupyter for analysis, Tableau for visualization, and Notion for documentation — combining all three in a single Notion-like workspace where SQL query results automatically become Python DataFrames accessible in subsequent code blocks. The built-in AI analyst understands your database schema and notebook context to generate SQL queries, write Python transformations, create visualizations, and fix errors on demand using configurable OpenAI or private LLM backends. Connect directly to PostgreSQL, MySQL, BigQuery, Redshift, Snowflake, and Amazon Athena as data sources, or upload CSV files for immediate analysis. Native point-and-click visualizations produce charts, tables, and dashboards without writing code, while interactive data apps use inputs, dropdowns, and date pickers to create parameterized reports for non-technical stakeholders. Scheduled execution runs notebooks and dashboards periodically with results delivered via Slack integration or public shareable links. Write-back queries modify production data directly from notebooks for ad-hoc pipeline testing. The architecture runs as three Docker containers — web frontend, API server, and optional AI service — backed by PostgreSQL and a Jupyter server for Python execution, deployable via single Docker command, Docker Compose, or Helm charts for Kubernetes. Running on a dedicated VPS on RepoCloud with guaranteed CPU, RAM, and SSD, full root SSH access, and a browser serial console. AGPLv3 licensed.
Quickwit
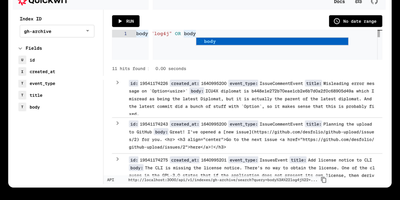
With over 11,000 GitHub stars and now backed by Datadog while remaining fully Apache 2.0 licensed, Quickwit delivers the search performance Elasticsearch users expect at a fraction of the infrastructure cost by moving the index to object storage instead of expensive local SSDs. The Rust-based engine, built on the Tantivy search library with SIMD-accelerated vectorized processing and zero garbage collection overhead, achieves sub-second search latency directly against Amazon S3, Azure Blob Storage, Google Cloud Storage, or any S3-compatible backend like MinIO and Ceph. The Elasticsearch-compatible REST API covers ingest, search, query DSL, and aggregations, enabling existing log shippers including Vector, Fluent Bit, and Syslog to migrate without rewriting configurations. Native OpenTelemetry Protocol endpoints accept logs and traces via gRPC, while Jaeger integration provides a drop-in distributed tracing backend. Ingestion from Apache Kafka, Amazon Kinesis, and Apache Pulsar supports streaming pipelines with multi-index partitioning, and the schemaless JSON indexing mode eliminates the need for upfront schema definitions. Stateless searchers and indexers scale horizontally on Kubernetes or bare metal, with a control plane that distributes indexing tasks and a janitor that manages retention policies and GDPR-compliant deletions. The built-in web UI displays search results and cluster state, while the official Grafana data source enables log exploration dashboards. Running on a dedicated VPS on RepoCloud with guaranteed CPU, RAM, and SSD, full root SSH access, and a browser serial console. Apache 2.0 licensed.
Redash
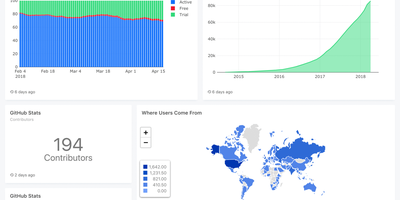
Used by millions of users at thousands of organizations worldwide and holding 29,000+ GitHub stars, Redash is the most established open-source SQL-first business intelligence tool — enabling anyone from analysts to executives to query databases, visualize results, and share dashboards without writing a single line of application code. The browser-based query editor supports SQL and NoSQL with schema browsing, auto-complete, query snippets, and parameterized queries that turn static reports into interactive data applications. Native connectors span 35+ data sources including PostgreSQL, MySQL, Amazon Redshift, Google BigQuery, Snowflake, ClickHouse, MongoDB, Elasticsearch, Databricks, Apache Presto, Microsoft SQL Server, and REST APIs — with an extensible data source API for custom integrations. Visualization types cover line, bar, area, pie, scatter, box plot, funnel, cohort, sankey, sunburst, choropleth map, and pivot tables, all draggable onto shared dashboards with cross-filtering parameters. Scheduled refreshes automatically update query results at configurable intervals, while threshold-based alerts notify teams via email, Slack, or webhook when metrics cross defined boundaries. SAML and Google OAuth SSO integration, role-based access control, API key management, and query-level permissions ensure enterprise-grade security for sensitive datasets. The self-hosted stack deploys via Docker Compose with PostgreSQL for metadata storage, Redis for job queuing, and Celery workers for background task execution. Running on a dedicated VPS on RepoCloud with guaranteed CPU, RAM, and SSD, full root SSH access, and a browser serial console. BSD 2-Clause licensed.

Notifuse
Marketing campaigns and transactional mail from one open-source platform: Notifuse is a modern, self-hosted alternative to Mailchimp, Brevo, and Klaviyo without per-email or per-contact pricing. Built with Go and React on PostgreSQL, it separates concerns cleanly: a drag-and-drop visual builder composes responsive templates from MJML components with Liquid variables like {{ contact.first_name }} and per-template version history; campaigns add A/B testing across subject lines, content, and send times; and a REST transactional API serves application-triggered mail. Delivery routes through your choice of provider - Amazon SES, Mailgun, Postmark, SendGrid, SparkPost, Mailjet, or plain SMTP - with multi-provider failover. Contacts carry custom fields and a full activity timeline (messages, profile changes, webhook events), and real-time segmentation builds dynamic rules over properties, activity, and subscriptions. Event-driven automations create behavioral sequences, a notification center gives recipients self-service preference management, and an S3-compatible file manager handles images with CDN delivery. Multi-tenant workspaces with isolated databases and custom domains suit agencies. Open and click tracking report engagement in real time.
Countly
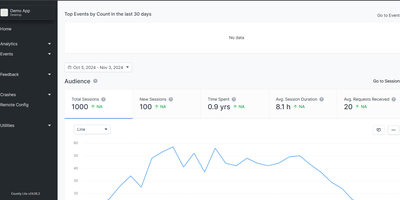
Mixpanel, OneSignal, and Crashlytics in one self-hosted stack - Countly is an all-in-one product analytics and engagement platform where every byte of first-party data stays on your server. A Node.js application over MongoDB, it collects through ten battle-tested SDKs spanning iOS, Android, web JavaScript, React Native, Flutter, Unity, and desktop (plus a data write API for anything else), and has powered tens of thousands of mobile, web, and desktop apps since 2012. The analytics core covers sessions, custom events, views, user profiles, and real-time dashboards, with exploration tools built for product managers as much as analysts. What separates Countly from pure analytics tools is acting on the data without third parties: built-in push notifications send automated, transactional, and personalized messages to iOS (APNs), Android (Firebase), and Huawei devices, with the SDK handling token retrieval and permission flows automatically; crash reporting captures symbolicated native crashes on iOS and Android plus JavaScript errors, correlated with the same user and session data. Email reports keep stakeholders updated, and the plugin-based architecture means features load as modules. For GDPR-sensitive products, engagement without piping user data to advertising companies is the entire point. AGPL-licensed server, installable in minutes.
Chartbrew
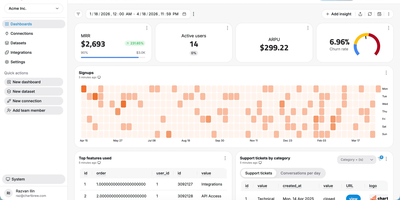
Chartbrew transforms raw database queries and API responses into polished, shareable dashboards without requiring a data engineering team. Connect to MySQL, PostgreSQL, MongoDB, Firestore, or any REST API, then build datasets using the visual query editor with syntax highlighting and auto-completion. Charts render through Chart.js with line, bar, pie, donut, radar, polar, KPI card, and table visualizations, each customizable with colors, legends, filters, and goal indicators. An AI assistant accelerates dashboard creation by generating queries and suggesting chart configurations from natural language descriptions of the metrics you want to track. Reusable datasets let teams prepare data transformations once and share them across multiple charts, while automatic scheduling through BullMQ and Redis refreshes data at intervals from every 10 minutes to monthly. The embed feature generates standalone chart URLs for insertion into external websites, internal tools, or customer portals, and the Reporting API enables programmatic dashboard management and automated report delivery. Team workspaces with role-based permissions control who can view, edit, or manage data connections. Nearly 4,000 GitHub stars reflect steady community adoption. The platform runs on Node.js with Express and Sequelize ORM, supporting MySQL or PostgreSQL as its application database. Running on a dedicated VPS on RepoCloud with guaranteed CPU, RAM, and SSD, full root SSH access, and a browser serial console. FSL-1.1-MIT licensed (converts to MIT two years after each release).
Bloomberg Terminal
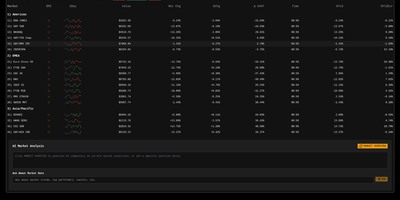
With 1,450+ GitHub stars and a live demo on Vercel, this Bloomberg Terminal clone delivers a professional-grade financial dashboard without the $24,000 annual seat license. The Next.js 15 App Router with React 19 and TypeScript serves a single-page terminal interface optimized for constantly mutating financial data, with partial pre-rendering enabling sub-500ms initial loads even on data-heavy views. Upstash Redis caches AlphaVantage market data to minimize API calls while maintaining sub-second update latency through React Query polling with configurable refresh rates. OpenAI integration provides AI-powered market insights, sentiment analysis, and trend interpretation directly within the terminal interface. Multiple specialized views cover market data tables with bid/ask spreads, financial news aggregation with category filtering, market movers highlighting top gainers and losers, and volatility analysis with historical comparison charts. Jotai atoms manage local state for watchlists, layout preferences, and terminal sessions while React Query handles server-state synchronization with aggressive stale-while-revalidate caching. The shadcn/ui component library with Tailwind CSS delivers accessible, keyboard-navigable interface elements styled after Bloomberg's iconic dark terminal aesthetic. Security features include origin restriction, rate limiting via Redis, and Zod-based input validation on all API routes. Motion (formerly Framer Motion) animates transitions between views and data updates without layout shift. Running on a dedicated VPS on RepoCloud with guaranteed CPU, RAM, and SSD, full root SSH access, and a browser serial console. MIT licensed.
Swetrix
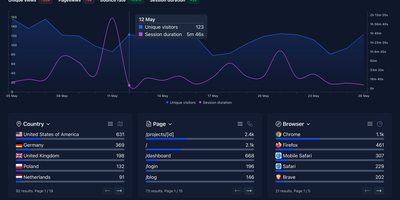
Traffic analytics, real-user performance monitoring, and client-side error tracking - normally three tools - in one cookieless, privacy-first dashboard: Swetrix. The Community Edition ships the same core engine as the cloud product - a NestJS API with ClickHouse for high-volume event storage, MySQL for relational data, and Redis for caching, fronted by a React dashboard and a ~5 KB tracking script with official packages for 20+ frameworks including Next.js, WordPress, and Shopify. Traffic analytics cover pageviews, referrers, UTM campaigns, geolocation, sessions with page flows, funnels, and custom events - all anonymized server-side with no cookies, no cross-device tracking, and no consent banner required for GDPR compliance. Performance monitoring records real-user metrics per pageview: TTFB, DNS and TLS timing, and render times, so regressions surface in the same place as traffic. Error tracking captures unhandled JavaScript exceptions automatically with formatted stack traces, filename/line metadata, affected browsers and pages, first/last-seen timestamps, and a resolve workflow - replacing a separate error monitoring subscription for many teams. Alerts fire to email, Slack, Telegram, Discord, or webhooks on traffic spikes, new errors, and custom events. If Plausible covers your traffic questions but you also want to know why the site broke, Swetrix answers both.