Rackula
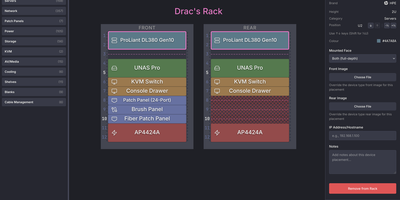
Before lifting a heavy four-unit storage server or rewiring a cramped network closet, you can map every unit of cabinet space in Rackula, an interactive drag-and-drop rack layout designer and capacity planner. Instead of staring at generic grey rectangles in a spreadsheet, you pull switches, routers, patch panels, UPS battery banks, and rackmount chassis from a hardware catalog populated with authentic front and rear faceplates from the NetBox device library. Equipment snaps cleanly to standard EIA-310 rack unit boundaries, while half-width gear and mini PCs nest inside one-unit carrier shelves and mounting brackets. Audiovisual technicians can group bayed cabinets side by side to plan amplifier racks, signal processor chains, and patch bays across multi-rack installations. Network engineers and data center operators can rearrange hardware with full undo and redo history, attach custom device graphics, and export crisp diagrams as PNG, SVG, or PDF files for runbooks and change control tickets. Sharing a proposed cabinet topology with a colleague in the field takes seconds using an encoded URL or a scannable QR code that opens on mobile browsers. Server-side persistence stores your rack definitions as portable YAML files and supports optional local accounts or OpenID Connect single sign-on for shared infrastructure teams. Running on a dedicated VPS on RepoCloud with guaranteed CPU, RAM, and SSD, full root SSH access, and a browser serial console. MIT licensed.
Nautobot
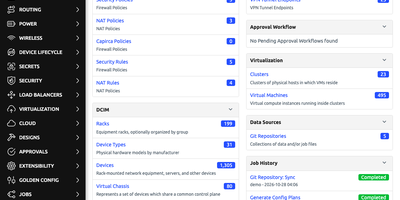
From the first rack to the last circuit, Nautobot is the open-source network source of truth that records what your network should look like and runs automation against it. Built-in models cover locations, racks, devices, interfaces, cables, VLANs, VRFs, IP prefixes, circuits, and contacts, so one searchable record replaces the spreadsheet and the wiki. Teams encode their own standards with custom fields, user-defined relationships, computed fields, and validation rules. Config contexts attach JSON or YAML data, such as syslog servers, to devices by location, role, platform, or tag. Jobs run your own automation code from the web UI, REST API, or command line, on a schedule, or through hooks when an object changes, with approvals and logs built in. Query the data over REST or GraphQL, and let the GraphiQL editor autocomplete a device and interface query you can save inside Nautobot. When an object is created, updated, or deleted, webhooks notify outside systems, with Jinja2-templated bodies and HMAC SHA-512 signatures. Git repositories can carry export templates, Jobs, and config contexts too, so YAML data and Jinja2 templates get pull request review before Nautobot syncs them. Open-source Apps add Golden Configuration for config backup, compliance, and remediation, Device Lifecycle for hardware tracking, SSoT for syncing other systems, and ChatOps. Object permissions and change logging keep a shared instance auditable. Running on a dedicated VPS on RepoCloud with guaranteed CPU, RAM, and SSD, full root SSH access, and a browser serial console. Apache-2.0 licensed.
Circuit Breaker
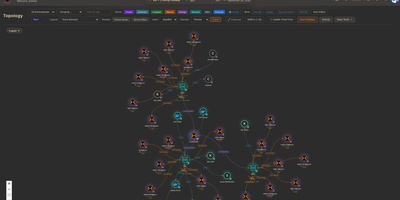
Mapping every physical server, virtual machine, container, and network link across a sprawling homelab into a live interactive canvas, Circuit Breaker gives infrastructure operators real-time topology visualization, IP address management, and rack elevation modeling on a single screen. Operators can switch between hierarchical, concentric, cortex ring, radial, and force-directed graph layouts where animated edges reflect link speeds and color-coded status rings display live hardware health. Automated discovery scans local subnets using nmap, SNMP, and ARP while querying Proxmox VE clusters, TrueNAS storage pools, and UniFi controllers, staging newly detected nodes in a review queue before adding them to the map. For multi-site labs or isolated VLANs, lightweight remote agents connect outbound over Noise-encrypted links after fingerprint approval to report host telemetry and run scoped network scans without opening inbound firewall ports. Rack diagrams let administrators drag servers into U slots with cabling overlays using a built-in catalog covering Dell, HPE, Supermicro, Ubiquiti, MikroTik, Synology, and APC gear alongside live iDRAC, iLO, and UPS metrics. Role-based access control, OIDC single sign-on, TOTP multi-factor authentication, encrypted full-state snapshots, and a SHA-256 hash-chained audit log keep multi-user operations accountable. Running on a dedicated VPS on RepoCloud with guaranteed CPU, RAM, and SSD, full root SSH access, and a browser serial console. MIT licensed.
RackPeek
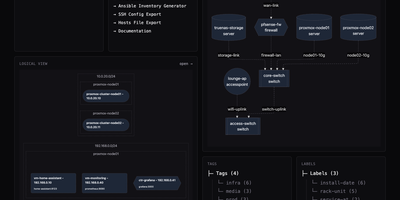
Every server, switch port, virtual machine, and network VLAN in a homelab or small IT environment can be cataloged, visualized, and exported through RackPeek's unified web interface and command-line toolkit. Operators record rack-mounted servers, managed switches, routers, firewalls, wireless access points, and uninterruptible power supplies alongside their CPU, memory, and storage specifications in a clean browser dashboard. Beyond physical gear, the inventory tracks operating systems, containerized or bare-metal services, IP subnets, and port-to-port cable connections while organizing assets with searchable tags and key-value labels. From that structured inventory, the interactive visualization engine renders live physical wiring diagrams and logical subnet-grouped service maps that export directly as high-resolution PNG graphics or Mermaid flowcharts. Because all state lives in a single human-readable configuration file backed by built-in Git repository synchronization, teams can version-control infrastructure changes or push automated updates through the authenticated REST API with dry-run diff previews. Day-to-day administration becomes faster with built-in generators that turn your cataloged hosts into ready-to-use Ansible inventory files, SSH client configurations, and tag-filtered hosts tables. Line-and-column validation feedback in the web editor catches schema mistakes immediately before changes are committed. Running on a dedicated VPS on RepoCloud with guaranteed CPU, RAM, and SSD, full root SSH access, and a browser serial console. AGPL-3.0 licensed.
Ralph
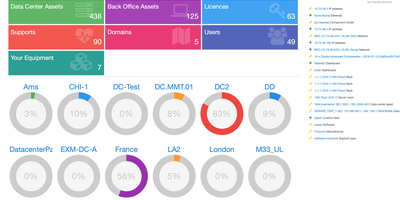
Ralph tracks thousands of assets across data centers and back offices through a unified CMDB, DCIM, and asset management platform, providing the same capabilities as ServiceNow, Device42, and Sunbird dcTrack without per-asset licensing fees. Used by Allegro in production and backed by over 2,500 GitHub stars, it is built on Python 3 with Django and Django REST Framework. Interactive data center floor plans support drag-and-drop rack placement, front and rear rack views showing U-level asset positioning, power consumption tracking per PDU, and ethernet and fiber connection mapping. The back office module manages laptops, desktops, printers, mobile phones, and accessories with user assignment tracking, warehouse inventory, stock-taking audits, and automated loan workflows. IP address management handles network environments with DHCP and DNS integration alongside network topology visualization. Software license tracking monitors per-user and per-core allocations with usage calculations, compliance reporting, and expiration alerts, while vendor support contracts track SLA agreements and warranty renewal dates. The transitions system automates asset lifecycle processes through configurable workflows that trigger HTTP webhooks, custom Python scripts, email notifications, and Puppet and Ansible configuration management integration. Custom fields extend the data model with text, numbers, dates, choices, and URLs per asset type, accessible via the REST API. Multi-tenant architecture organizes assets by regions, data centers, service environments, and business units. Deploy via Docker with the allegro/ralph image alongside MySQL and Redis. Running on a dedicated VPS on RepoCloud with guaranteed CPU, RAM, and SSD, full root SSH access, and a browser serial console. Apache 2.0 licensed.