Laminar
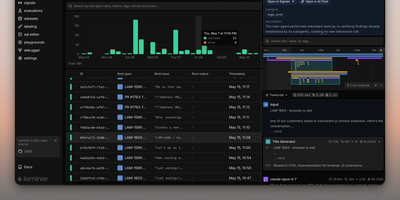
Backed by Y Combinator (S24) and processing traces from thousands of AI agents in production, Laminar is the open-source observability platform that treats agent debugging as a first-class engineering discipline rather than an afterthought. Its OpenTelemetry-native SDK auto-instruments Vercel AI SDK, LangChain, OpenAI, Anthropic, Gemini, Browser Use, Stagehand, Mastra, Pydantic AI, and the OpenAI Agents SDK with a single line of code, capturing every LLM turn, tool call, and sub-agent delegation as nested spans with full input/output data and token costs. The Signals engine lets you describe failures in plain language — "agent is stuck in a loop" or "tool returned empty results" — then reads every trace and alerts via Slack when it detects a match. A built-in debugger records runs and replays them from cache so each iteration takes seconds, designed for Claude Code, Cursor, or Codex to drive the repair loop via the MCP server or CLI. Run code-first evaluations in Python or TypeScript locally or in CI/CD pipelines, build datasets from production traces, and query everything with raw SQL through custom dashboards, the in-app editor, or your coding agent. The Rust backend delivers 20x trace compression, a custom real-time streaming engine, ultra-fast full-text search, and gRPC ingestion, while ClickHouse powers columnar analytics and PostgreSQL stores application state. Running on a dedicated VPS on RepoCloud with guaranteed CPU, RAM, and SSD, full root SSH access, and a browser serial console. Apache 2.0 licensed.
Evidently
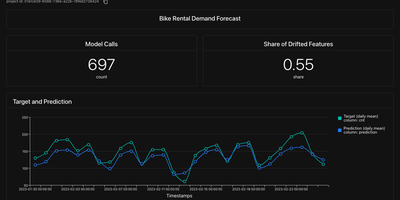
Evidently gives your models and LLM apps a proper check-up and keeps every result on one shared dashboard. Project dashboards chart predictions against targets, data drift, and quality scores over time, with counters for model calls and the share of drifted features. A reports page lists every evaluation snapshot with tags, metadata, timestamps, and view or download buttons, and a search box filters them by metadata. Over 100 built-in metrics cover data quality, classification, regression, ranking, recommendations, text descriptors, and LLM judges. Test suites add pass or fail conditions, so a nightly job can flag a drifting feature before customers notice a bad prediction. Datasets, traces, and prompts have their own tabs, which keeps retrieval and generation experiments beside the scores they produced. Reports export as HTML or JSON for sharing outside the dashboard. Results live in a local folder, a SQL database, or S3-compatible storage, and a remote workspace accepts snapshots sent from jobs running anywhere. Built-in demo projects with bike demand forecasting and e-commerce review classification show how a finished dashboard looks before you wire in your own data. Running on a dedicated VPS on RepoCloud with guaranteed CPU, RAM, and SSD, full root SSH access, and a browser serial console. Apache 2.0 licensed.