Categories
Self-Hosted Data Science LLM Evaluation AI Observability MLOps Data Drift Detection Model Quality ML MonitoringStars
Forks
Watchers
Developer links
Evidently
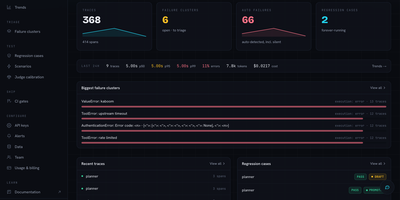
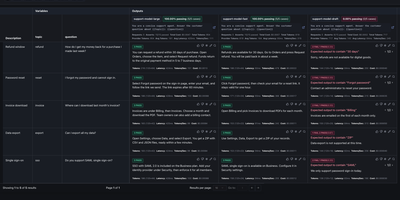
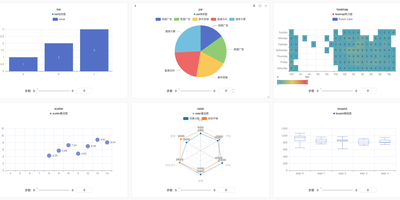
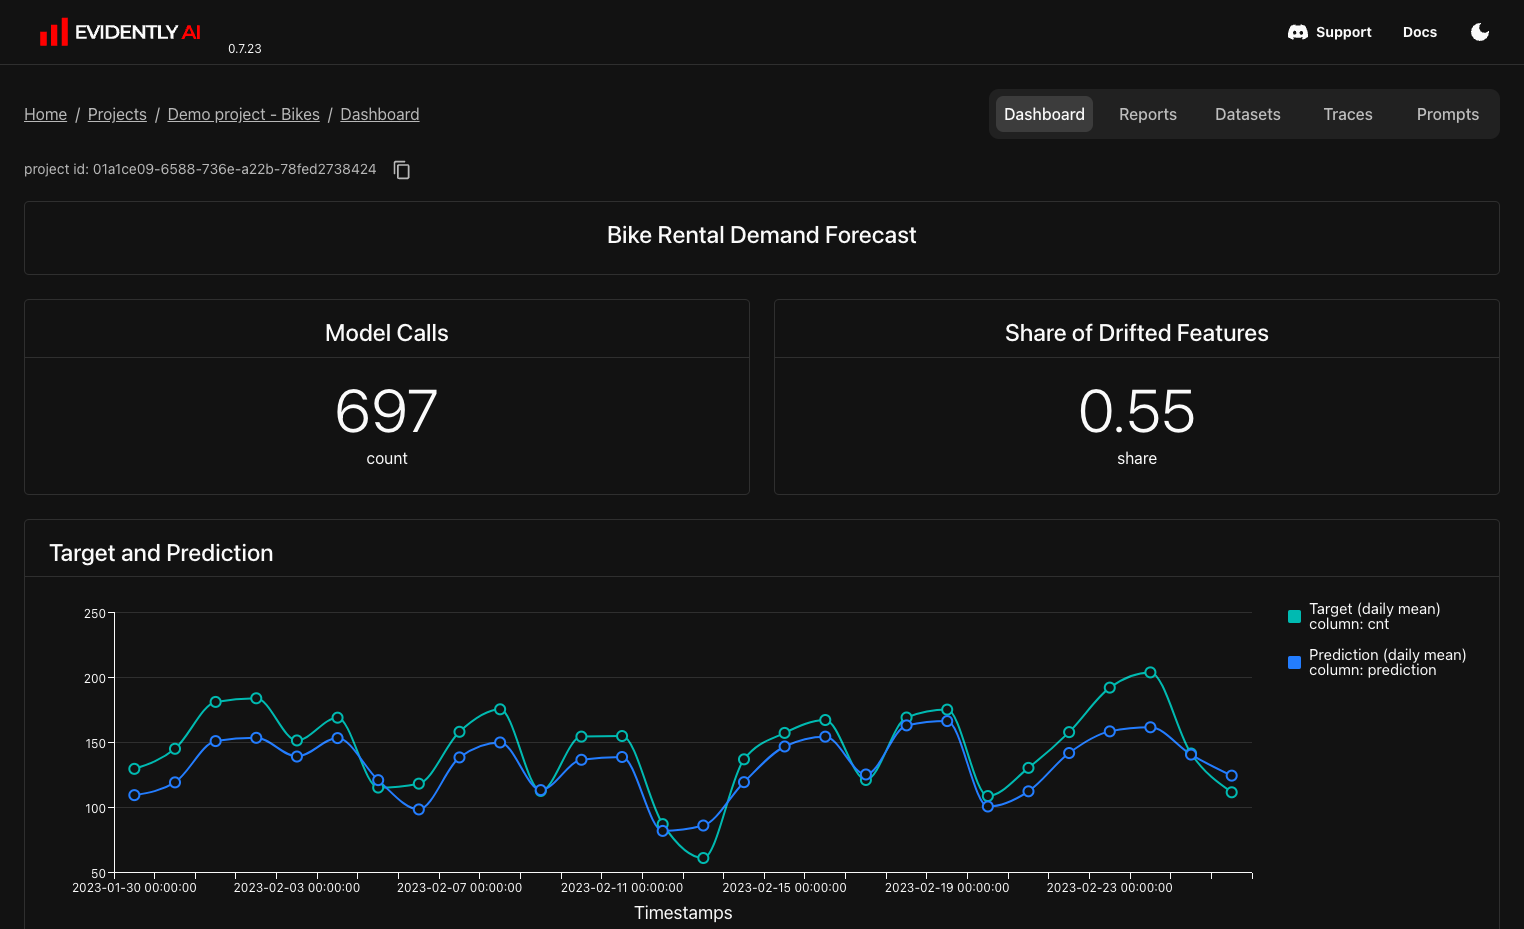
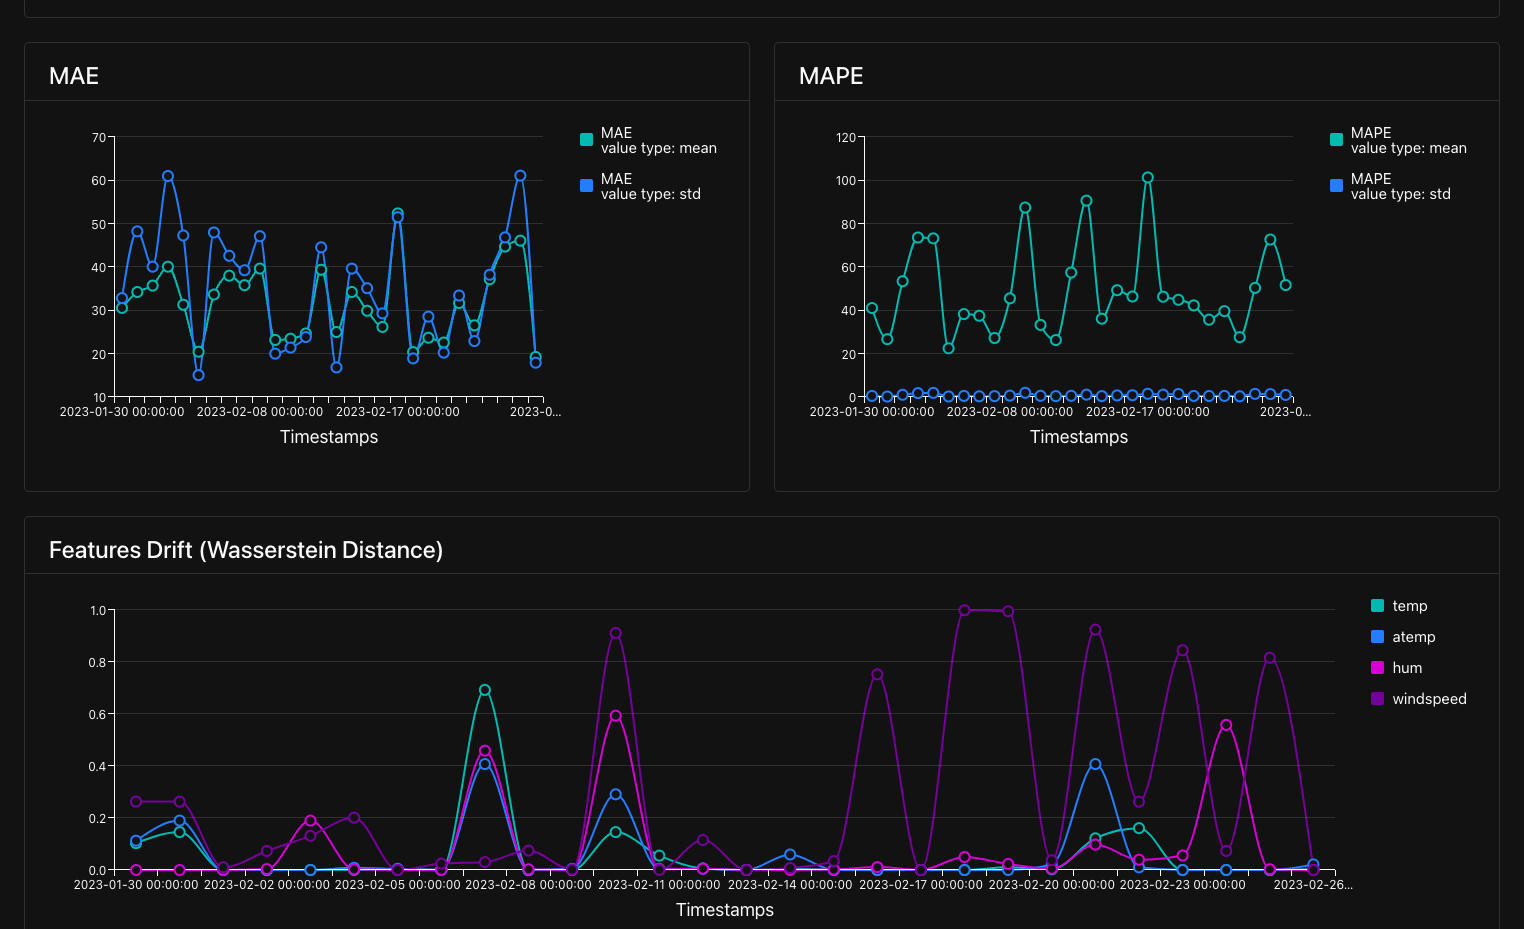
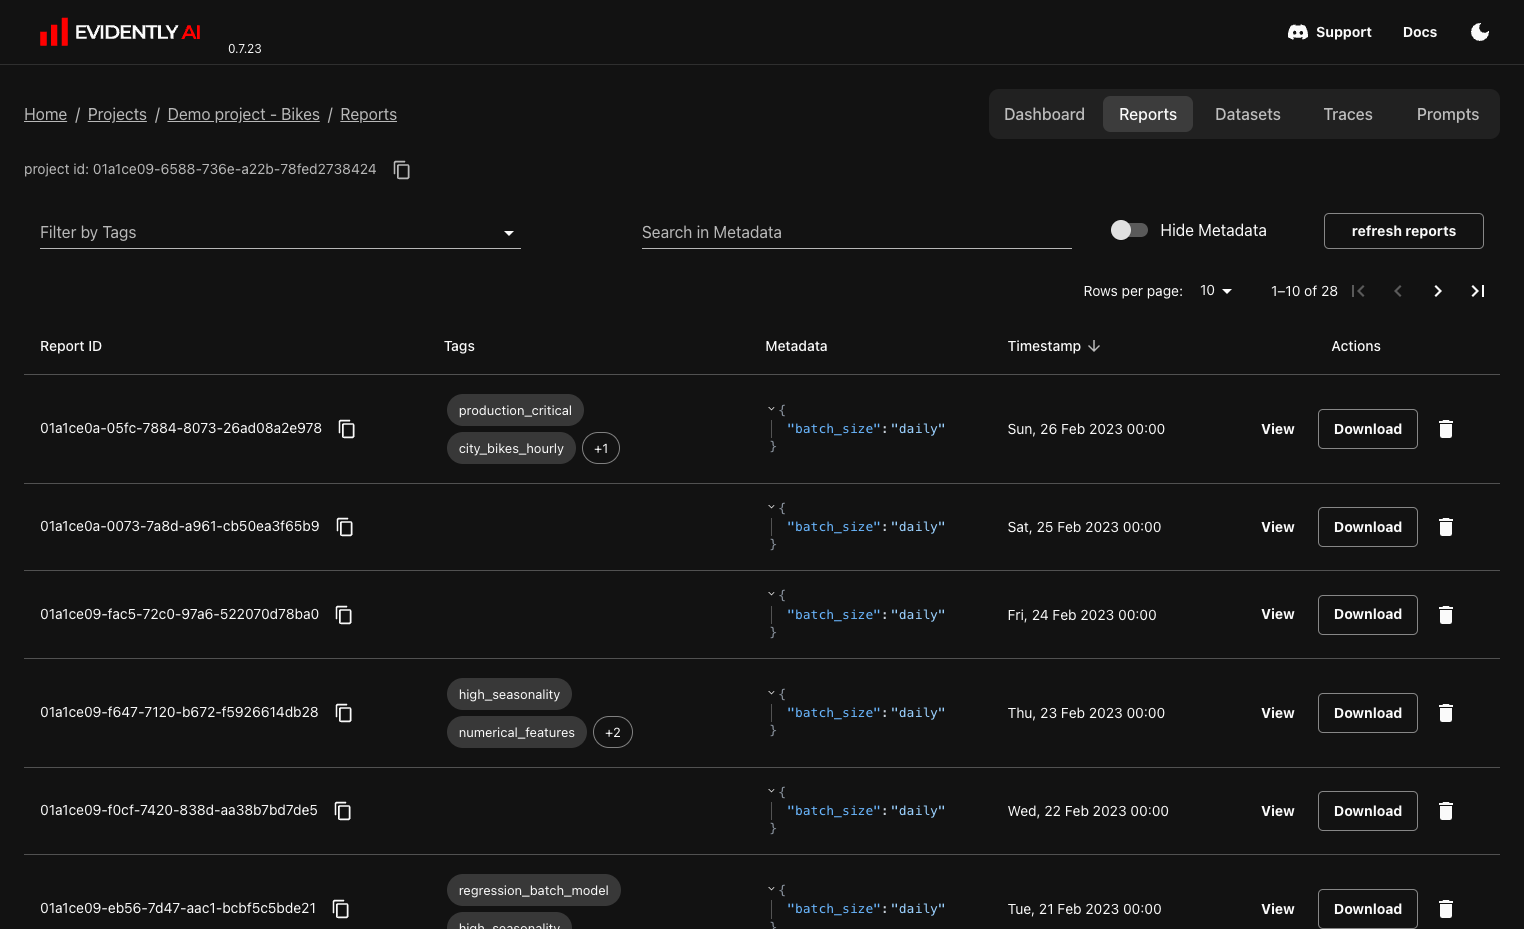
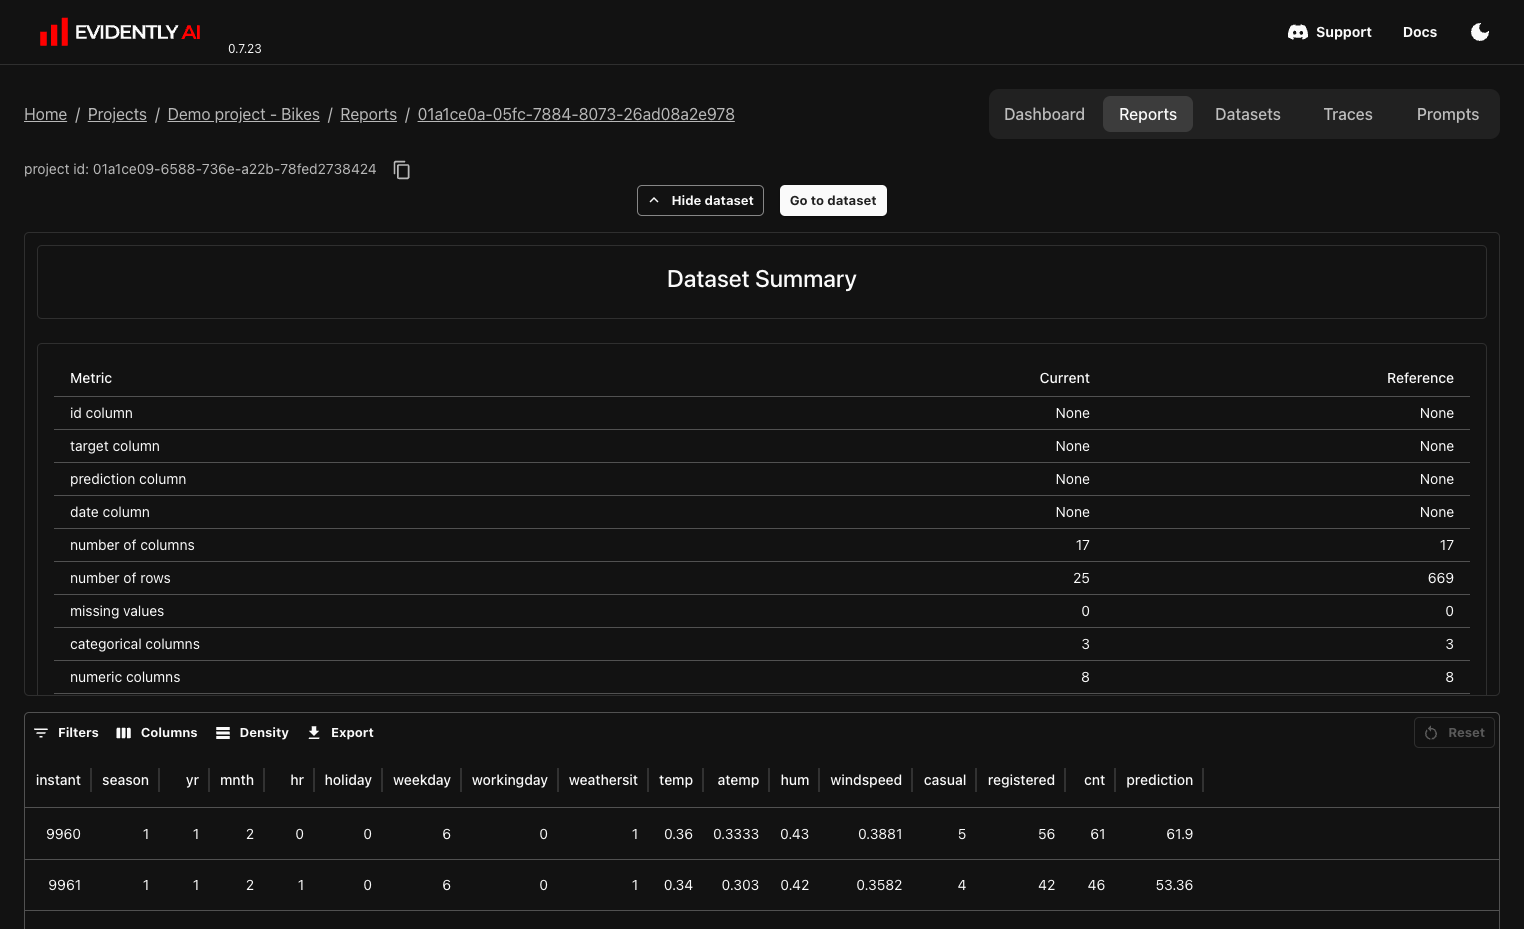
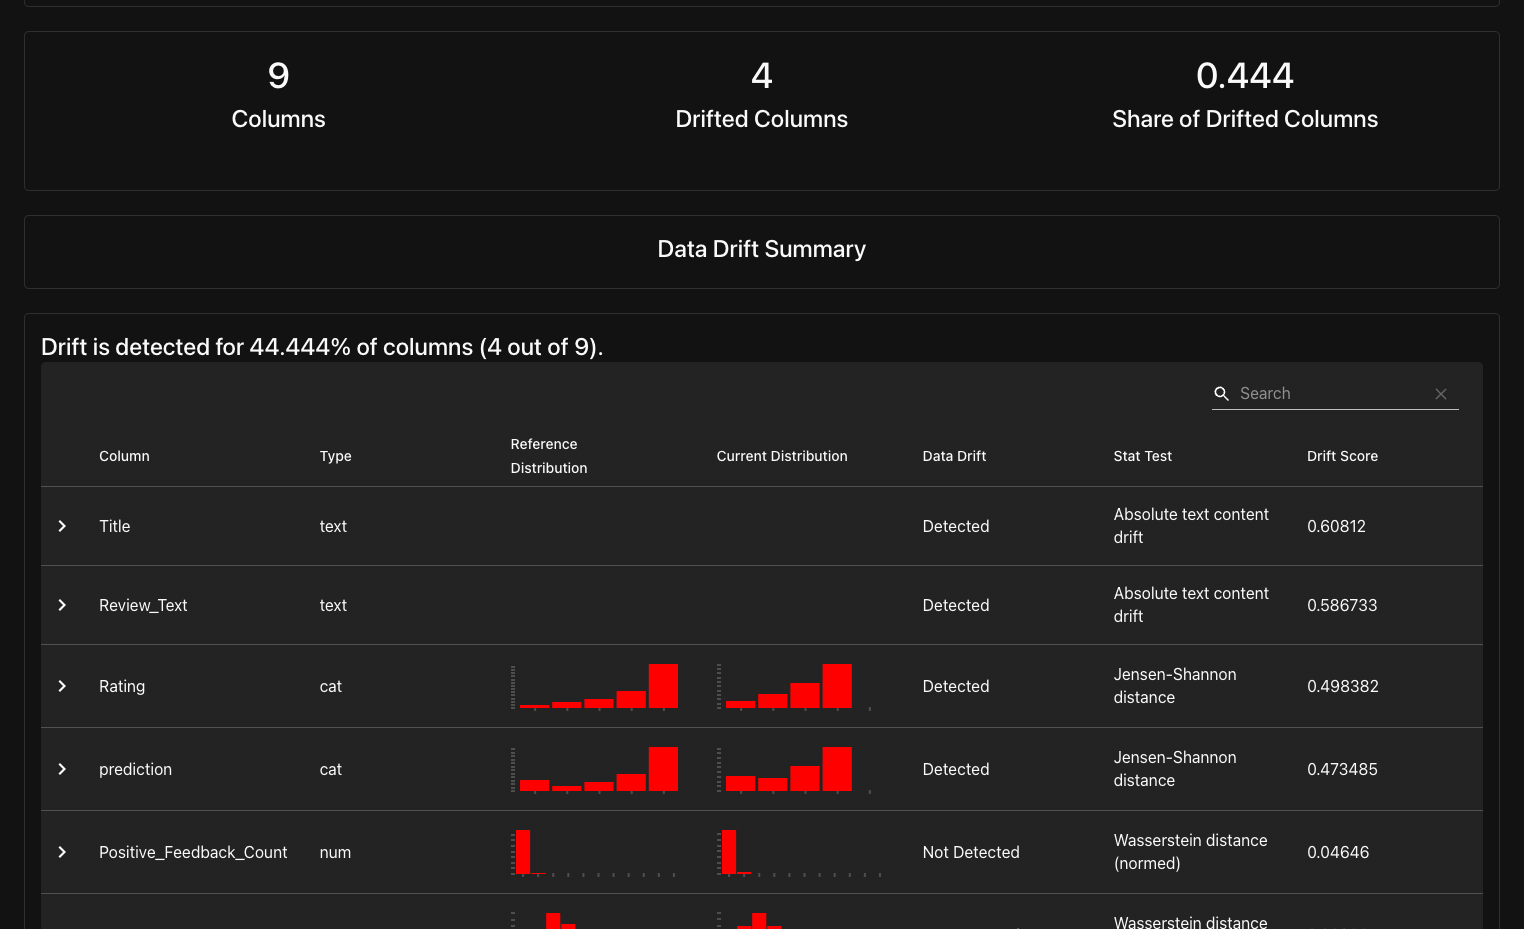
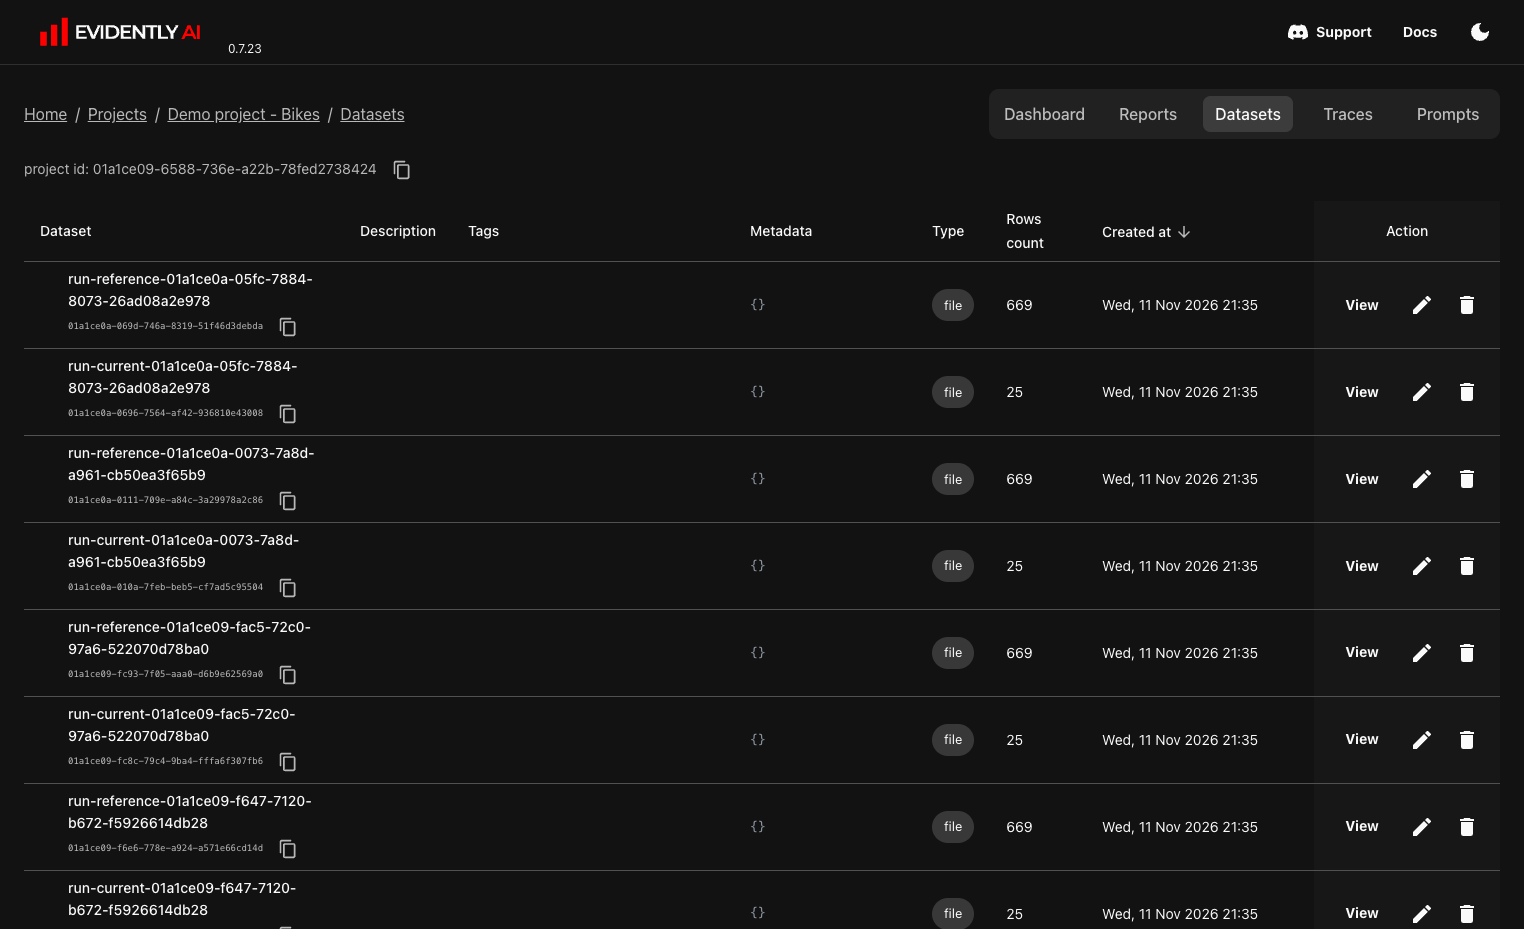
Evidently gives your models and LLM apps a proper check-up and keeps every result on one shared dashboard. Project dashboards chart predictions against targets, data drift, and quality scores over time, with counters for model calls and the share of drifted features. A reports page lists every evaluation snapshot with tags, metadata, timestamps, and view or download buttons, and a search box filters them by metadata. Over 100 built-in metrics cover data quality, classification, regression, ranking, recommendations, text descriptors, and LLM judges. Test suites add pass or fail conditions, so a nightly job can flag a drifting feature before customers notice a bad prediction. Datasets, traces, and prompts have their own tabs, which keeps retrieval and generation experiments beside the scores they produced. Reports export as HTML or JSON for sharing outside the dashboard. Results live in a local folder, a SQL database, or S3-compatible storage, and a remote workspace accepts snapshots sent from jobs running anywhere. Built-in demo projects with bike demand forecasting and e-commerce review classification show how a finished dashboard looks before you wire in your own data. Running on a dedicated VPS on RepoCloud with guaranteed CPU, RAM, and SSD, full root SSH access, and a browser serial console. Apache 2.0 licensed.
Benefits
- Spot Drift Before Users Do
- Dashboard panels chart target versus prediction and the share of drifted features over time, so a degrading model shows up on a graph before it shows up in complaints.
- One Place For Every Evaluation
- Each report snapshot is saved with tags, metadata, and a timestamp, so teammates can search past runs, open them, or download them instead of rerunning notebooks.
- Evaluate Classic ML And LLMs
- One platform covers tabular models and text or LLM outputs, so a team that ships both a forecaster and a chatbot does not need two monitoring tools.
- Keep Data In Your Storage
- Workspaces write to a local folder, a SQL database, or S3-compatible storage that you control, so evaluation data and model inputs never leave your own servers.
Features
- Project Monitoring Dashboards
- Panels show counters, line charts, and distributions for each project, including target versus prediction, drift share, model calls, and quality scores across the time range.
- Searchable Report Archive
- The reports tab lists every snapshot with tags, metadata, and timestamp, supports filtering by tag and metadata search, and offers view and download actions per report.
- Metrics And Test Suites
- More than 100 built-in metrics cover drift, data quality, classification, regression, ranking, and LLM judges, and test conditions turn any report into a pass or fail check.
- Datasets Traces And Prompts
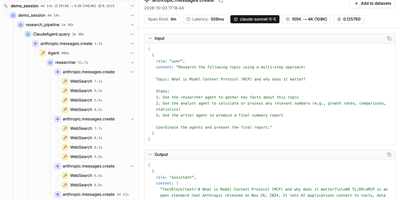
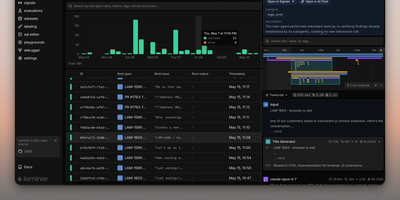
- Separate tabs organize evaluation datasets, application traces, and prompt versions, so LLM experiments stay linked to the project and results that they belong to.
- Flexible Workspace Storage
- Store snapshots on a file system, in SQLite or Postgres, or on S3-compatible storage, and send new ones to a remote workspace from any job or pipeline.
- Built-In Demo Projects
- Start the server with demo projects for bike demand forecasting and e-commerce review classification to explore a populated dashboard and reports before adding your own.