TraceRoot
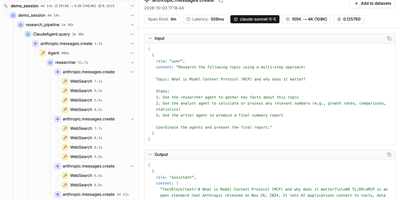
An agent run can finish without errors and still give the wrong answer, so TraceRoot traces every model and tool call, flags the production runs that missed the mark, and helps your coding agent ship verified fixes. Each run becomes a browsable call tree with inputs, outputs, latency, and cost, searchable by session or filter. Instrument with the Python or TypeScript SDK, the agent-native CLI, or any OpenTelemetry exporter, with ready integrations for LangChain, LangGraph, OpenAI Agents SDK, CrewAI, Vercel AI SDK, Mastra, and Pydantic AI. Detectors use LLM judges to score live traffic against the behavior you define and can post alerts to Slack. Judge outputs cluster into signals, then a background coding agent reads the traces and your connected GitHub code in a sandbox and recommends changes down to the commit, file, and line. Datasets, test cases, and scored eval runs compare versions so regressions surface before a release, and dashboards of widgets chart your trace data. The CLI hands your coding agent, such as Claude Code or Codex, the traces, signals, detectors, and evals to work from. Self-hosting keeps all of that trace data on infrastructure you control. Running on a dedicated VPS on RepoCloud with guaranteed CPU, RAM, and SSD, full root SSH access, and a browser serial console. Apache-2.0 licensed (core edition).
Laminar
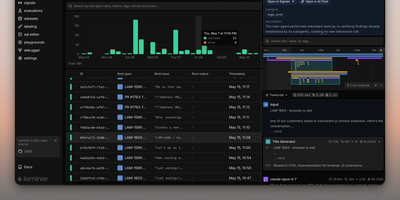
Backed by Y Combinator (S24) and processing traces from thousands of AI agents in production, Laminar is the open-source observability platform that treats agent debugging as a first-class engineering discipline rather than an afterthought. Its OpenTelemetry-native SDK auto-instruments Vercel AI SDK, LangChain, OpenAI, Anthropic, Gemini, Browser Use, Stagehand, Mastra, Pydantic AI, and the OpenAI Agents SDK with a single line of code, capturing every LLM turn, tool call, and sub-agent delegation as nested spans with full input/output data and token costs. The Signals engine lets you describe failures in plain language — "agent is stuck in a loop" or "tool returned empty results" — then reads every trace and alerts via Slack when it detects a match. A built-in debugger records runs and replays them from cache so each iteration takes seconds, designed for Claude Code, Cursor, or Codex to drive the repair loop via the MCP server or CLI. Run code-first evaluations in Python or TypeScript locally or in CI/CD pipelines, build datasets from production traces, and query everything with raw SQL through custom dashboards, the in-app editor, or your coding agent. The Rust backend delivers 20x trace compression, a custom real-time streaming engine, ultra-fast full-text search, and gRPC ingestion, while ClickHouse powers columnar analytics and PostgreSQL stores application state. Running on a dedicated VPS on RepoCloud with guaranteed CPU, RAM, and SSD, full root SSH access, and a browser serial console. Apache 2.0 licensed.
Langfuse
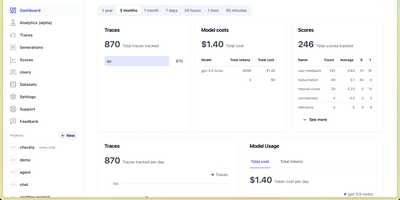
Backed by Y Combinator and trusted by over 2,300 companies processing billions of observations monthly, Langfuse is the most widely adopted open-source platform for building, monitoring, evaluating, and debugging LLM applications. The hierarchical tracing engine captures every LLM call, tool invocation, retrieval step, and agent action as nested spans based on OpenTelemetry, with automatic cost calculation, latency tracking, and token usage attribution across sessions and users. Prompt Management separates prompts from code with versioned artifacts, label-based deployments, one-click rollbacks, and runtime SDK fetching with server-side caching, while linking every generation back to its exact prompt version for attribution analytics. The evaluation system supports LLM-as-a-judge scoring, heuristic code evaluators, user feedback collection, and manual annotation workflows that run automatically on production traces or against curated datasets. The Playground enables interactive prompt testing on real production inputs with side-by-side model comparison across providers. Datasets and Experiments define test cases for systematic benchmarking with comparative result visualization. Native SDKs for Python and TypeScript provide decorator-based instrumentation, while 100+ integrations cover LangChain, LlamaIndex, OpenAI SDK, LiteLLM, Vercel AI SDK, and any OpenTelemetry-instrumented framework. The analytics dashboard surfaces cost breakdowns, quality scores, latency percentiles, and usage trends across models and prompt versions. Running on a dedicated VPS on RepoCloud with guaranteed CPU, RAM, and SSD, full root SSH access, and a browser serial console. MIT licensed.
Tracely
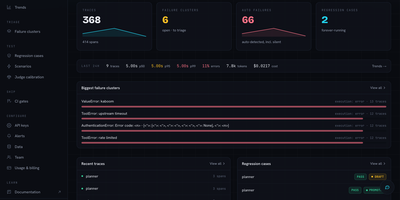
When an AI agent breaks in production, Tracely freezes that exact run into a replayable regression test and blocks the pull request that would ship the bug again. Span soup hides the failure. OTLP/HTTP traces group into conversation threads, and a waterfall marks the failing span in red with its input and output. Nobody knows if an answer was good. Evaluators sit as columns on the trace table, mixing model-free checks with LLM judges at conversation, run, or span level. Thirty-one broken runs, one issue. Clustering turns them into a single counted issue and can suggest the evaluator that would have caught it. A fix nobody can prove. One click promotes a failing trace into a hermetic case with recorded fixtures and a fail-to-pass contract, and scenarios send a red-team model after an adversarial goal. Model bills on every CI run. The suite replays offline with no API keys and no model spend, and tracely gate posts a commit status, comments on the pull request, and blocks regressions. No warning when it breaks again. Alert flows drawn on a canvas react to failed gates, broken conversations, unseen failure modes, or rising failure rates by messaging Slack, sending email, calling a webhook, or prompting an LLM. Coding agents can read traces and write evaluators through an MCP endpoint. Running on a dedicated VPS on RepoCloud with guaranteed CPU, RAM, and SSD, full root SSH access, and a browser serial console. MIT licensed.