Netdata
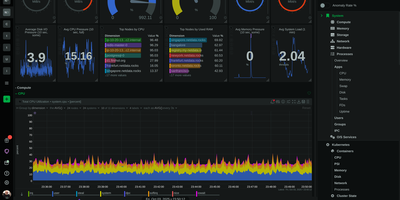
Trusted by millions of engineers and deployed on over 80,000 GitHub stars worth of community confidence, Netdata delivers true real-time monitoring at per-second granularity — 10-60x faster than Prometheus, Datadog, or any conventional monitoring stack that averages away the transient anomalies lasting 2-10 seconds where most production incidents originate. A single installation command deploys the agent with zero configuration, automatically discovering every running process, container, systemd service, network connection, disk, and application on the host within seconds. Unsupervised machine learning trains multiple models per metric directly at the edge, detecting anomalies without thresholds, baselines, or manual tuning. The distributed Parent-Child architecture scales horizontally from a single Raspberry Pi to fleets exceeding 100,000 nodes while maintaining sub-2-second visualization latency and storing metrics at approximately 0.5 bytes per sample through tiered compression. Native network monitoring provides live topology maps, NetFlow and sFlow analytics, SNMP device polling across 200+ profiles, and trap handling — capabilities that typically require a separate NPM product. Hundreds of pre-configured alerts cover systems and applications out of the box, with AI-powered root cause analysis surfacing correlated metrics through natural language via MCP-compatible AI assistants. The agent supports Linux, macOS, FreeBSD, Kubernetes, and Docker with eBPF-based kernel observability requiring no application instrumentation. Running on a dedicated VPS on RepoCloud with guaranteed CPU, RAM, and SSD, full root SSH access, and a browser serial console. GPL v3+ licensed.
Percona PMM
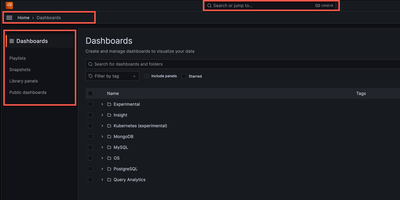
Backed by 1,080+ GitHub stars and maintained by Percona with the latest release v3.8.1 in June 2026, Percona Monitoring and Management delivers the open-source database observability platform that provides a single pane of glass across MySQL, PostgreSQL, MongoDB, Valkey, and Redis databases deployed on-premises, cloud, or hybrid environments. The Go-powered PMM Server collects metrics from lightweight PMM Client agents with minimal performance impact, storing time-series data in ClickHouse for fast querying across configurable retention periods. Query Analytics ranks every query by load across all database engines from one unified dashboard, drilling from fleet-level performance down to individual problematic queries with explain plans, per-query metrics, and anomaly detection. Real-time Query Analytics streams live MongoDB operations updated every 1-5 seconds for immediate troubleshooting of lock contention and long-running queries. Built-in Percona Advisors continuously scan connected databases for security gaps, misconfigurations, and performance problems, distilling decades of DBA expertise into automated actionable recommendations. Percona Alerting integrates with 15+ notification channels including Slack, PagerDuty, email, and webhooks to trigger on custom metric thresholds. Database-specific dashboards visualize InnoDB storage engine details, WiredTiger cache metrics, PostgreSQL tuple activity, replication lag, and cluster health with annotations for root-cause correlation. Deployment options include Docker single-container setup, Podman rootless execution, and Helm charts for Kubernetes with Ingress controller support and ConfigMap management. Running on a dedicated VPS on RepoCloud with guaranteed CPU, RAM, and SSD, full root SSH access, and a browser serial console. AGPL-3.0 licensed.