Traceway
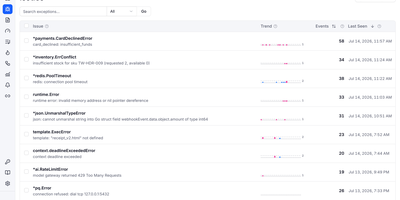
Production debugging slows to a crawl when logs, distributed traces, metrics, and session replays live in four disconnected dashboards, which is why Traceway consolidates every OpenTelemetry signal into a single self-hosted observability platform. Point any standard OTLP exporter directly at the ingestion endpoints without maintaining an intermediary collector or installing proprietary vendor SDKs. When an unhandled exception fires in production, automatic SHA-256 stack trace fingerprinting groups duplicates into prioritized issues complete with source-mapped frames and attached browser or Flutter session replays showing exact user clicks before the crash. Clicking any structured log entry jumps straight to its corresponding distributed span waterfall so engineers can trace slow database queries or failing downstream HTTP calls across microservices. Route performance bottlenecks surface immediately through per-endpoint P50, P95, and P99 latency percentiles ranked by Apdex and a five-factor impact score. Teams shipping AI features can also inspect LLM token consumption, model costs, tool calls, and multi-turn conversations grouped by customer identifier. Built-in on-call rotation schedules, escalation policies, and multi-channel alerts via Slack, Telegram, Pushover, email, and webhooks ensure incidents reach the right responder with one-click acknowledgment links. Running on a dedicated VPS on RepoCloud with guaranteed CPU, RAM, and SSD, full root SSH access, and a browser serial console. MIT licensed.
VictoriaLogs
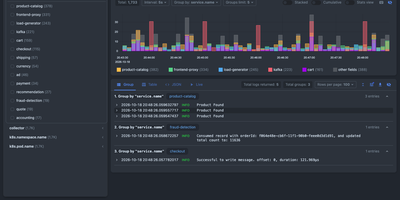
Instead of running an Elasticsearch or Loki cluster, VictoriaLogs stores and searches your logs from a single zero-config server. Ship from Filebeat, Fluent Bit, Fluentd, Logstash, Vector, Promtail, Telegraf, the OpenTelemetry Collector, or the Datadog Agent. Syslog, journald, and Splunk endpoints work too. Query with LogsQL: word, phrase, and prefix filters combine with pipes that extract fields from raw lines and compute stats, top values, and facets. See results as a table, grouped by stream, as raw JSON, or as a live tail. Chart them in Grafana, or work from a terminal with vlogscli and pipe output into grep, less, or jq. Events with hundreds of fields are supported. So are high-cardinality fields like trace_id and user_id. Late, out-of-order backfills are accepted. During an incident, stream_context pulls the lines around any match. Tenants are keyed by AccountID and ProjectID headers. vmalert evaluates LogsQL queries as alerting and recording rules. CEF messages sent over Syslog are parsed automatically for SIEM work. Retention defaults to 7 days and can be capped by disk space. Per-day partitions snapshot and copy out with rsync or rclone. Cluster mode splits ingestion, querying, and storage across nodes for logs that outgrow one server. Running on a dedicated VPS on RepoCloud with guaranteed CPU, RAM, and SSD, full root SSH access, and a browser serial console. Apache 2.0 licensed.
Uptrace
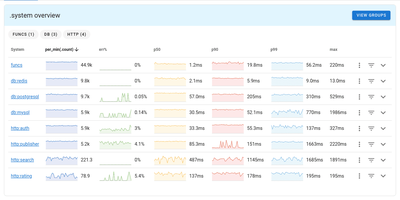
Pinpoint distributed system bottlenecks across polyglot microservices using Uptrace, an open telemetry monitoring platform that correlates traces, metrics, and logs inside a unified diagnostic dashboard. Engineers can track end-to-end request flows across polyglot microservices, inspecting database queries, third-party API calls, and internal function calls with sub-millisecond precision. The platform automatically aggregates spans into high-level latency percentiles, highlighting p50, p90, and p99 bottlenecks while calculating baseline error rates across production deployments. Integrated log correlation links log entries directly to parent trace spans, eliminating the friction of manual search across separate monitoring tools during active outages. You can construct custom dashboard views using a visual query builder, monitor cluster nodes, and map out upstream and downstream service dependencies with interactive topological graphs. Automated alerting channels notify on-call teams via Slack, Telegram, webhooks, or email whenever error budgets or metric thresholds trigger an incident. Running on a dedicated VPS on RepoCloud with guaranteed CPU, RAM, and SSD, full root SSH access, and a browser serial console. AGPL-3.0 licensed.