Peekaping
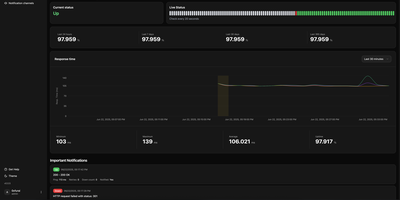
Keep users ahead of outages by consolidating infrastructure monitoring into Peekaping, a unified uptime monitoring and incident communication platform that alerts engineering teams to network and application failures before customers experience disruptions. Users can configure automated synthetic checks across HTTP endpoints, database engines, message queues, and container runtimes to verify response latency, payload integrity, and SSL certificate expiration. When performance thresholds degrade or connections drop, the platform broadcasts structured incident notices across twenty-two notification channels including Slack, Discord, Telegram, PagerDuty, and custom webhooks. Visual dashboards display live heartbeat timelines, historical latency percentiles, and rolling availability scores for each monitored endpoint. System administrators can assemble custom public status pages with custom domains, branded color schemes, and component grouping to inform external stakeholders during planned maintenance or unforeseen service degradations. Teams can schedule recurring maintenance windows to pause alert notifications during routine deployments and generate API tokens to automate monitor creation directly from CI/CD deployment pipelines. Running on a dedicated VPS on RepoCloud with guaranteed CPU, RAM, and SSD, full root SSH access, and a browser serial console. MIT licensed.
Karma
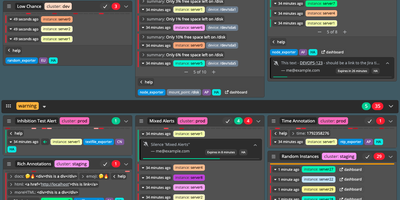
When an alert fires on any of your Prometheus Alertmanagers, Karma shows it once, on one filterable dashboard, and lets you acknowledge or silence it from there. Identical alerts from different servers merge into one entry tagged with every server that saw it, HA pairs included. Groups follow the group_by settings of your Alertmanager routes, and shared labels and annotations collapse into a footer. Multi-grid mode gives each value of a label, or each Alertmanager, cluster, or receiver, its own grid, keeping production and staging apart. Configurable label colors make hosts and severities easy to spot. Optional history draws 24 hourly blocks per group from the Prometheus servers that fired it, and an inhibited alert's muted button lists whatever is suppressing it. One click acknowledges an alert with a short-lived silence, and the separate kthxbye daemon can keep extending it until the alert resolves. The silence modal creates, edits, and expires silences, and ticket IDs in comments can become links. A Dead Man's Switch check raises a visible error when the alerting pipeline goes quiet. Basic auth or a proxy's header identifies each user, silence ACLs stop one team from silencing another's alerts, and read-only mode disables silence management. Default filters open the view your team triages first, and light and dark themes follow the browser. Running on a dedicated VPS on RepoCloud with guaranteed CPU, RAM, and SSD, full root SSH access, and a browser serial console. Apache-2.0 licensed.