Quickwit
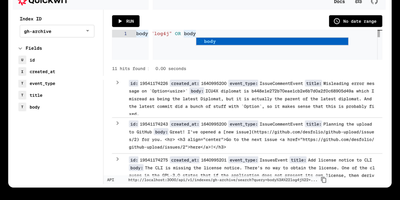
With over 11,000 GitHub stars and now backed by Datadog while remaining fully Apache 2.0 licensed, Quickwit delivers the search performance Elasticsearch users expect at a fraction of the infrastructure cost by moving the index to object storage instead of expensive local SSDs. The Rust-based engine, built on the Tantivy search library with SIMD-accelerated vectorized processing and zero garbage collection overhead, achieves sub-second search latency directly against Amazon S3, Azure Blob Storage, Google Cloud Storage, or any S3-compatible backend like MinIO and Ceph. The Elasticsearch-compatible REST API covers ingest, search, query DSL, and aggregations, enabling existing log shippers including Vector, Fluent Bit, and Syslog to migrate without rewriting configurations. Native OpenTelemetry Protocol endpoints accept logs and traces via gRPC, while Jaeger integration provides a drop-in distributed tracing backend. Ingestion from Apache Kafka, Amazon Kinesis, and Apache Pulsar supports streaming pipelines with multi-index partitioning, and the schemaless JSON indexing mode eliminates the need for upfront schema definitions. Stateless searchers and indexers scale horizontally on Kubernetes or bare metal, with a control plane that distributes indexing tasks and a janitor that manages retention policies and GDPR-compliant deletions. The built-in web UI displays search results and cluster state, while the official Grafana data source enables log exploration dashboards. Running on a dedicated VPS on RepoCloud with guaranteed CPU, RAM, and SSD, full root SSH access, and a browser serial console. Apache 2.0 licensed.
OpenObserve
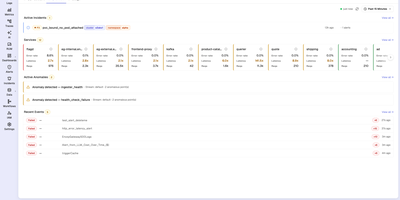
With 20,500+ GitHub stars and over 6,000 organizations running it in production — including a Fortune 100 company ingesting more than 4 PB per day — OpenObserve is the open-source observability platform that replaces your entire Datadog, Splunk, or ELK stack with a single Rust binary deploying in under two minutes. Apache Parquet columnar storage with zstd compression on S3-compatible object storage delivers 140x lower storage costs than Elasticsearch while providing better query performance on a quarter of the hardware. Ingest logs, metrics, and distributed traces via native OpenTelemetry OTLP endpoints with no vendor lock-in. Query logs and traces with standard SQL, metrics with SQL or PromQL — no proprietary query language to learn. The built-in dashboard builder offers 19 chart types including time-series graphs, heatmaps, gauges, tables, and top-K lists with drag-and-drop layout combining data from all signal types. Data pipelines process, enrich, redact, or normalize ingestion streams using Vector Remap Language for real-time transformations including PII redaction and logs-to-metrics conversion. Real User Monitoring captures frontend performance with session replay. The Service Catalog provides topology-based trace analysis with side-panel drill-downs into database queries and error details. Alerting supports real-time and scheduled rules with SQL and PromQL conditions. Native multi-tenancy isolates organizations and streams with complete data separation. Running on a dedicated VPS on RepoCloud with guaranteed CPU, RAM, and SSD, full root SSH access, and a browser serial console. AGPLv3 licensed.
Rootprint
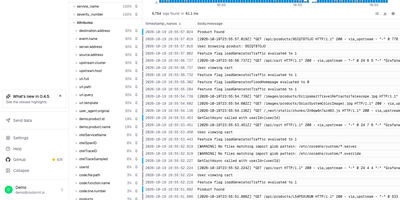
A year of searchable logs and traces no longer needs a metered logging service, because Rootprint keeps the whole index in a storage bucket you already own. A search matches any word on any line, since every log is indexed in full and no service name, stream, or label is needed first. A frequency histogram, one-click field filters, and saved views narrow the results, a fold mode collapses repeated lines, and exports arrive as NDJSON, CSV, or plain text, or as a share link. Open a trace from the log that emitted it, or paste a trace ID, and a waterfall shows per-span timing, attributes, events, and database calls grouped by query, with each span linking back to its logs. The trace explorer charts span volume, error rate, and p50, p95, and p99 latency, ranks the busiest operations, and filters spans by service, duration, and status. Every service gets its own page with request rate, error rate, operations, dependencies, and errors. Data arrives over OpenTelemetry from the Collector, Vector, or Fluent Bit, through a plain HTTP gateway, or by pulling from Kafka, Kinesis, or SQS, with guided setup for nine integrations. Indexes can live in S3, Google Cloud Storage, R2, MinIO, or Azure Blob. Teammates sign in with Google, GitHub, or any OpenID Connect provider, and scoped API keys serve scripts. Running on a dedicated VPS on RepoCloud with guaranteed CPU, RAM, and SSD, full root SSH access, and a browser serial console. Apache-2.0 licensed.
HyperDX
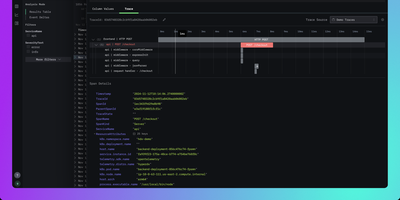
HyperDX correlates logs, metrics, traces, session replays, and errors in a single interface so engineers can resolve production incidents in minutes instead of hours. Nearly 10,000 GitHub stars reflect its role as the integrated UI layer for the ClickStack blueprint endorsed by ClickHouse. The platform connects to any ClickHouse cluster as its storage backend, working with existing table structures without requiring data migration or proprietary ingestion formats. An intuitive Lucene-like search syntax supports full-text queries and property filtering like level:err or service.name:api without needing SQL, while native JSON string querying and event delta analysis surface anomalies in high-cardinality datasets. One-click cross-signal correlation lets you jump from a log line to its distributed trace, from a slow span to associated logs, or from a frontend session replay to the backend errors it triggered. The OpenTelemetry Collector accepts telemetry via OTLP on gRPC port 4317 and HTTP port 4318, supporting automatic instrumentation for Node.js, Python, Java, Go, Ruby, and browser applications. APM tracks HTTP request latency, database query duration, and external service calls with trace waterfall visualizations. Configurable alerts trigger via webhook, Slack, PagerDuty, or email when thresholds are breached. Deploys via Docker Compose with ClickHouse, MongoDB, Redis, and the OpenTelemetry Collector. Running on a dedicated VPS on RepoCloud with guaranteed CPU, RAM, and SSD, full root SSH access, and a browser serial console. MIT licensed.
SigNoz
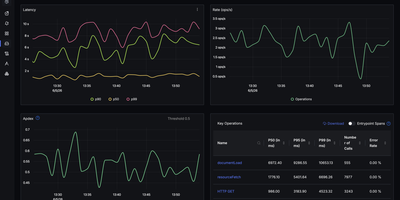
With over 31,000 GitHub stars and native OpenTelemetry support that eliminates vendor lock-in from day one, SigNoz delivers full-stack observability covering metrics, traces, and logs in a single pane of glass without the per-host pricing model of commercial APM platforms. The platform ingests telemetry data through the OpenTelemetry Collector, supporting auto-instrumentation for Java, Python, Node.js, Go, Ruby, PHP, and .NET applications with zero code changes required for basic tracing. ClickHouse serves as the columnar storage backend, providing fast aggregation queries over billions of spans and log lines with configurable retention policies and tiered storage. The distributed tracing view renders flame graphs and Gantt charts showing request flow across microservices with latency breakdowns, error rates, and p99 percentile calculations. Custom dashboards support PromQL and ClickHouse SQL queries with time-series charts, bar graphs, tables, and value widgets. The log management pipeline supports structured and unstructured logs with full-text search, log pipelines for parsing and enrichment, and correlation with traces via trace IDs. Alert rules can be configured on any metric or log query with notification channels including Slack, PagerDuty, OpsGenie, webhooks, and email. The exceptions monitoring module automatically groups and tracks application errors with stack traces, occurrence counts, and first-seen timestamps. Service maps visualize inter-service dependencies with real-time latency and error rate overlays. Running on a dedicated VPS on RepoCloud with guaranteed CPU, RAM, and SSD, full root SSH access, and a browser serial console. MIT licensed with an enterprise edition available.
Jaeger
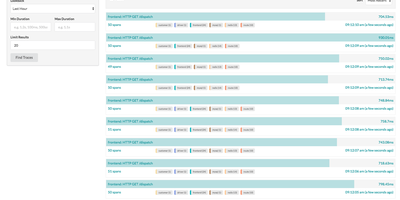
Created by Uber Technologies and graduated as the seventh CNCF top-level project in October 2019 with over 23,000 GitHub stars, Jaeger has become one of the most widely deployed open-source distributed tracing platforms, processing billions of spans per day in production environments at organizations including Uber, Red Hat, and Shopify. Version 2 rebuilt the platform on the OpenTelemetry Collector framework, inheriting its extensible pipeline architecture while implementing Jaeger-specific features as extensions and components, enabling seamless integration with the OpenTelemetry ecosystem through native OTLP protocol support. The platform stores traces in Cassandra 4.0+, Elasticsearch 7.x/8.x, OpenSearch 1.0+, ClickHouse, or the embedded Badger database for development setups. Three sampling strategies control trace volume: head-based sampling with constant, probabilistic, and rate-limiting modes, tail-based sampling using the OpenTelemetry Collector processor that evaluates complete traces before storage decisions, and adaptive sampling that dynamically adjusts probabilities based on observed traffic patterns. Service Performance Monitoring computes RED metrics directly from spans, displaying request rates, error rates, and latency percentiles in the Monitor tab with drill-down from aggregate service views to individual traces. The web UI provides trace search with multi-field filtering, trace detail views with span timeline visualization, trace comparison across services, and dependency graphs mapping service relationships from actual traffic. Deployment options range from a single all-in-one binary for development to distributed collector-ingester-query configurations with Kafka intermediate buffering for production scale. Running on a dedicated VPS on RepoCloud with guaranteed CPU, RAM, and SSD, full root SSH access, and a browser serial console. Apache 2.0 licensed.
Observal
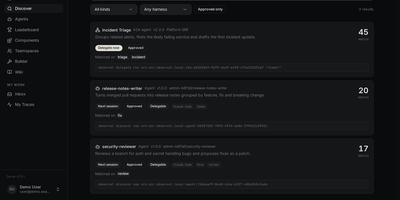
To pull a team's skills, MCP servers, hooks, prompts, and agent files out of scattered Git repositories, Observal keeps them in one reviewed registry and traces real sessions to show which ones help. Build an agent visually, with a live config preview for every harness. Submissions wait in an admin review queue, where reviewers inspect side-by-side version diffs before approving a release. Teamspaces give each team its own namespace, and approved releases can be forked into independent drafts. One pull command then writes the right config for Claude Code, Cursor, Kiro, Codex, Copilot, Pi, OpenCode, Antigravity, or Goose. Every approved resource is discoverable through the open Agentic Resource Discovery standard, and a running agent can hand part of its task to another approved agent or a remote Agent2Agent service. Hooks record each session as a trace of prompts, tool calls, MCP round trips, tokens, and errors, with turn-by-turn replay for debugging and audits. Insight reports, generated through providers such as Anthropic, OpenAI, or Ollama, list what is working, what is hindering, and quick wins. A dashboard follows adoption, cost, and department usage, a leaderboard ranks agents by downloads, and audit logs, SAML single sign-on, and SCIM provisioning are included. Running on a dedicated VPS on RepoCloud with guaranteed CPU, RAM, and SSD, full root SSH access, and a browser serial console. Apache-2.0 licensed.