MeshMonitor
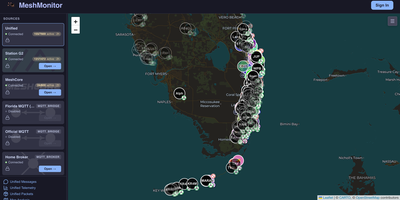
Off-grid radio networks are wonderful until you need to see all of them at once, and MeshMonitor puts every Meshtastic node, MeshCore companion, and MQTT broker on one shared dashboard. Each source keeps its own map, messages, telemetry, and traceroutes, and unified views merge them so a node heard by three radios appears once. Nodes plot on an interactive map with signal colors, clustering, topology overlays, and imported GeoJSON, KML, or KMZ zones. Channel chat supports replies, tapback reactions, and full-text search, and telemetry widgets chart battery, voltage, signal strength, and hop distribution over windows from 15 minutes to 7 days. Automation covers auto-responders, scheduled messages, auto-traceroute, and geofence triggers, with custom Node.js, Python, or shell scripts for anything else. A built-in MQTT broker and bridges filter traffic by topic, channel, or bounding box so a local mesh stays tidy. Security checks flag weak or duplicate encryption keys, and an audit log records every privileged action. Admins grant each person access to specific sources, using local accounts, OIDC sign-in, and MFA, and push alerts reach phones and chat apps through Apprise. Use it for a community mesh club, an emergency preparedness network, a fleet of solar-powered relays, or a neighborhood radio project. Running on a dedicated VPS on RepoCloud with guaranteed CPU, RAM, and SSD, full root SSH access, and a browser serial console. BSD-3-Clause licensed.
Percona PMM
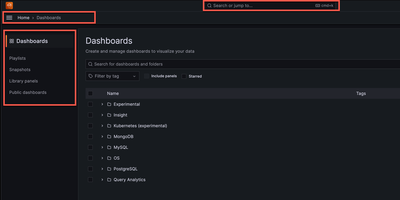
Backed by 1,080+ GitHub stars and maintained by Percona with the latest release v3.8.1 in June 2026, Percona Monitoring and Management delivers the open-source database observability platform that provides a single pane of glass across MySQL, PostgreSQL, MongoDB, Valkey, and Redis databases deployed on-premises, cloud, or hybrid environments. The Go-powered PMM Server collects metrics from lightweight PMM Client agents with minimal performance impact, storing time-series data in ClickHouse for fast querying across configurable retention periods. Query Analytics ranks every query by load across all database engines from one unified dashboard, drilling from fleet-level performance down to individual problematic queries with explain plans, per-query metrics, and anomaly detection. Real-time Query Analytics streams live MongoDB operations updated every 1-5 seconds for immediate troubleshooting of lock contention and long-running queries. Built-in Percona Advisors continuously scan connected databases for security gaps, misconfigurations, and performance problems, distilling decades of DBA expertise into automated actionable recommendations. Percona Alerting integrates with 15+ notification channels including Slack, PagerDuty, email, and webhooks to trigger on custom metric thresholds. Database-specific dashboards visualize InnoDB storage engine details, WiredTiger cache metrics, PostgreSQL tuple activity, replication lag, and cluster health with annotations for root-cause correlation. Deployment options include Docker single-container setup, Podman rootless execution, and Helm charts for Kubernetes with Ingress controller support and ConfigMap management. Running on a dedicated VPS on RepoCloud with guaranteed CPU, RAM, and SSD, full root SSH access, and a browser serial console. AGPL-3.0 licensed.
openITCOCKPIT
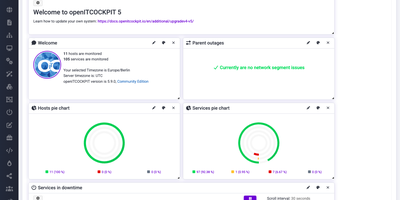
Point a browser at openITCOCKPIT, and templates and wizards create the monitoring checks that watch servers, network devices, containers, and applications. Wizards for Linux, Windows, macOS, MySQL, and network gear create hosts and services. A JSON API exposes the same configuration to scripts. A single-binary agent for Linux, macOS, and Windows reports CPU, memory, disks, services, processes, temperatures, and Docker containers over encrypted pull or push connections. Prometheus exporters, alert rules, and PromQL metrics sit beside classic Naemon checks and feed the same reports. Teams share dashboards with traffic lights, tachometers, and tables and show them on big screens, and Grafana boards are generated for every host. A WYSIWYG map editor places hosts, gauges, and charts on uploaded backgrounds like site plans or server racks, and a status map draws parent-child links automatically. Event correlation joins checks with logical operators into business services, so one cluster state replaces a flood of single alerts. Instant, downtime, and scheduled auto reports summarize availability, and a timeline records state changes, downtimes, and notifications. Alerts reach people by email, Mattermost, Pushover, or Telegram and can be acknowledged from the chat, and recurring downtimes silence planned maintenance. Multi-tenancy, role-based permissions, LDAP or Active Directory login, and single sign-on scope what each team sees. Running on a dedicated VPS on RepoCloud with guaranteed CPU, RAM, and SSD, full root SSH access, and a browser serial console. GPL-3.0 licensed.
Exceptionless
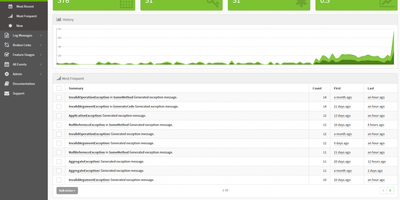
Exceptionless has earned over 2,400 GitHub stars and has been processing production errors since 2014 as the real-time event monitoring platform that captures far more than crashes. Built with ASP.NET Core on Elasticsearch for storage and Redis for caching, Exceptionless ingests exceptions, log messages, feature usage events, broken links, and custom event types through official SDKs for JavaScript, Node.js, .NET Core, ASP.NET, WPF, Web API, WebForms, Console apps, and React Native. Automatic event stacking groups related occurrences by exception type, message, and call stack into single actionable items, while manual stacking keys let developers create custom groupings for specific features or workflows. The real-time dashboard displays Most Frequent, Most Recent, and New event views with filtering by project, date range, environment, and custom tags. Stack management tracks resolution status with version-aware regression detection that automatically reopens resolved issues when the same error surfaces in a newer release. Webhook integrations connect to Slack, Discord, and external services through Zapier for automated issue tracking in GitHub Issues and Jira. Per-project notification settings control email and chat alerts for new errors, regressions, and critical events. OpenTelemetry support captures distributed traces alongside error data. The v8.6.0 release introduced a hosted Model Context Protocol server at the /mcp endpoint, enabling AI tools to query error data via OAuth-authenticated access. Deploy via Docker with the exceptionless/exceptionless image alongside Elasticsearch and Redis. Running on a dedicated VPS on RepoCloud with guaranteed CPU, RAM, and SSD, full root SSH access, and a browser serial console. Apache 2.0 licensed.
Icinga Web 2
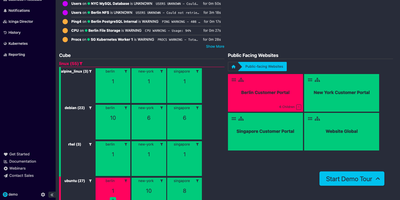
Icinga Web 2 is the browser interface for Icinga monitoring, giving operations teams one place to see which hosts and services are failing, how long they have been down, and what to fix first. Service problems, host problems, and summary tiles share a single dashboard page, and any filtered view can be added to a dashboard or the menu. Host and service lists switch between minimal, common, detailed, and table layouts, sort by severity, and filter through a search bar that autocompletes and accepts wildcards. A click on a service opens details beside the list, with plugin output, check statistics, performance data, comments, downtimes, and custom variables, plus buttons for Check Now, Comment, Downtime, and Reschedule. Modal dialogs keep acknowledgements and scheduled downtimes in context, and bulk operations act on a whole filtered list. The Tactical Overview condenses host and service states into two donut charts, and the Event Overview lists state changes and recoveries with their check output. Modules add Business Processes that group hosts and services into AND and OR trees, plus Cube, Director, Reporting, Notifications, and Kubernetes views. Roles combine permissions, refusals, and restrictions so each team sees only its own hosts, and logins run through Active Directory, LDAP, a database, or the web server. Language, time zone, and light or dark mode are set per user. Running on a dedicated VPS on RepoCloud with guaranteed CPU, RAM, and SSD, full root SSH access, and a browser serial console. GPL-3.0 licensed.
InfluxDB
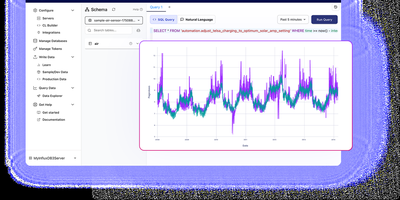
With over 31,600 GitHub stars and thousands of production deployments, InfluxDB 3 Core is the open-source time series database rebuilt in Rust on the FDAP stack — Apache Flight for high-throughput data transfer, DataFusion for vectorized SQL query execution, Arrow for columnar in-memory representation, and Parquet for compressed columnar storage. The engine delivers sub-10ms query response times on recent data and handles millions of writes per second through line protocol ingestion over HTTP, with unlimited tag cardinality eliminating the high-cardinality limitations that plagued earlier InfluxDB versions. The diskless architecture persists data as compressed Parquet files to S3-compatible object storage, Azure Blob, Google Cloud Storage, or local disk with configurable partitioning strategies, while the write-ahead log and in-memory buffer serve real-time queries against recent data before compaction. Native SQL support through DataFusion includes window functions, CTEs, subqueries, and joins, while InfluxQL maintains backward compatibility with existing InfluxDB 1.x and 2.x applications through the same query API. The embedded Python VM enables processing engine plugins and triggers that execute custom logic on write events, perform cross-database queries, and transform data in real time without external tooling. Flight SQL clients provide high-performance query access from Python, Go, Java, and Rust, and the HTTP API supports writes in line protocol format compatible with Telegraf's 300+ input plugins. Running on a dedicated VPS on RepoCloud with guaranteed CPU, RAM, and SSD, full root SSH access, and a browser serial console. MIT/Apache 2.0 dual-licensed.
GoAccess
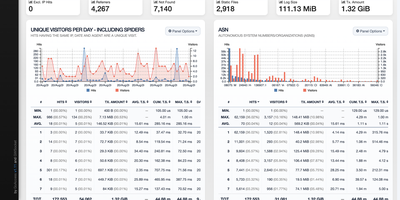
GoAccess processes millions of web log entries in seconds and renders the results as interactive dashboards that update every 200 milliseconds in the terminal or every second via WebSocket-connected HTML reports. Written entirely in C with only ncurses as a dependency, it achieves exceptional performance even on resource-constrained servers, reducing memory usage by approximately 20% and parsing time by 35% in recent releases through optimized in-memory hash tables with on-disk persistence support. The analyzer parses virtually every web log format out of the box (Apache Combined and Common, Nginx, Amazon CloudFront, Amazon S3, AWS Elastic Load Balancing, Google Cloud Storage, Squid, W3C IIS, Caddy JSON, and Traefik) while supporting fully custom log format strings for non-standard configurations. The self-contained HTML dashboard displays 15+ interactive panels covering unique visitors, requested files, static files, 404 errors, referring sites, search keyphrases, geographic location with city-level GeoIP resolution, operating systems, browsers, HTTP status codes, time distribution, and virtual host metrics. WebSocket authentication via JWT provides secure remote access, and incremental log processing ensures data continuity across daemon restarts. Docker deployment requires a single command with volume-mapped access logs. Over 20,800 stars with active development since 2010. Running on a dedicated VPS on RepoCloud with guaranteed CPU, RAM, and SSD, full root SSH access, and a browser serial console. MIT licensed.
Emoncms
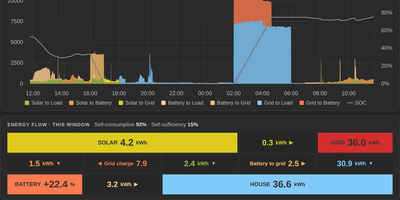
Energy meters, solar systems, heat pumps, and temperature sensors report to Emoncms, which logs every reading as a time series and turns it into graphs, dashboards, and ready-made apps. Readings arrive over an HTTP input API, MQTT topics beneath emon/, or AES-encrypted posts for devices without HTTPS, from scripts, Node-RED, Home Assistant, or emonHub. Input processing calibrates values, combines inputs, converts watts to cumulative kilowatt-hours, and logs the result to a feed. Device templates configure known hardware in one step, and schedules limit processes to set time windows. The graph viewer plots feeds on two axes, groups them into daily, weekly, monthly, or annual bars, and offers feed statistics and CSV export. Virtual feeds calculate values like heat pump COP on request and store nothing; post processing rebuilds feeds from recorded data. My Electric Flow charts live solar, battery, and grid power with an energy-flow breakdown and a Tariff explorer for Octopus Agile and other time-of-use tariffs. My Heatpump reports COP and SCOP. Other apps cover boilers, solar diversion, CO2 air change rates, and the UK grid fuel mix. The dashboard editor places dials, gauges, thermometers, charts, text, and images, and a dashboard can be made public. Sync uploads feeds to another server on a schedule and downloads them for recovery; the Backup module backs up and restores data. Running on a dedicated VPS on RepoCloud with guaranteed CPU, RAM, and SSD, full root SSH access, and a browser serial console. AGPL-3.0 licensed.
Alerta
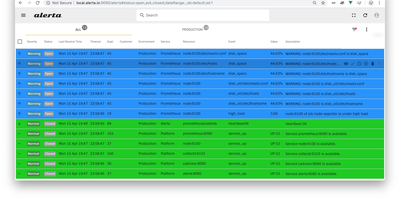
Five monitoring systems should not mean five places to look when something breaks at 3 a.m. Alerta is an open-source alert management server that consolidates alerts from many sources into a single stream, de-duplicates repeats, correlates severity changes, and shows only the current state of each problem in a web console built for fast scanning. Prometheus, Zabbix, Nagios, InfluxDB Kapacitor, cloud watch alarms, and your own scripts all post into the same HTTP API, which accepts a flexible alert format carrying environment, resource, event, severity, and custom attributes, so no tool has to contort itself into someone else's schema first. Repeats of a known fault raise a duplicate count instead of generating another page, and a severity change updates the existing alert rather than birthing a twin. Operators acknowledge problems, assign them, silence expected fire during blackout periods set for maintenance windows, and partition visibility by customer for teams that monitor other people's infrastructure. A command-line client, query language, webhooks, and plugin hooks carry alerts onward into tickets, chat, and paging workflows, and everything persists in MongoDB or PostgreSQL with API keys and OAuth protecting access. Running on a dedicated VPS on RepoCloud with guaranteed CPU, RAM, and SSD, full root SSH access, and a browser serial console. Apache-2.0 licensed.
Foreman
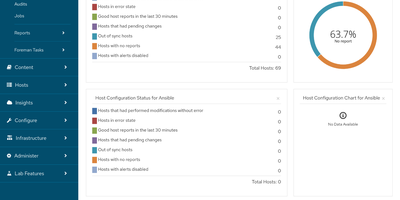
Foreman is the control room for a server fleet, taking machines from blank hardware or an empty VM to configured, monitored hosts through one web interface. Create a host entry and it network-boots by PXE or UEFI HTTP, or starts from a discovery image that phones home its hardware inventory so unknown machines can be claimed and built by rule. Installation runs from templates for Kickstart, Preseed, AutoYaST, Agama, and cloud-init, while host groups bundle the operating system, partition layout, and parameters that make every build of a role identical. The same console provisions onto bare metal, libvirt, VMware, oVirt, Amazon EC2, Google Compute Engine, and OpenStack, because each provider plugs in as a compute resource with its own images and networks. After installation, Puppet classes and parameters, Ansible roles with recurring runs, or Salt states keep configuration enforced, and the reports and facts those tools send back fill dashboards showing which hosts are current, which drifted, and which are erroring. Smart Proxy services carry DHCP, DNS, TFTP, and configuration enforcement into each subnet or datacenter segment, remote execution runs jobs across the fleet, and the Katello plugin adds content and patch management on top. Hammer gives the whole API a command-line face, and role-based access with LDAP or FreeIPA sign-in keeps large teams in their lanes. Running on a dedicated VPS on RepoCloud with guaranteed CPU, RAM, and SSD, full root SSH access, and a browser serial console. GPL-3.0 licensed.
DataBuff
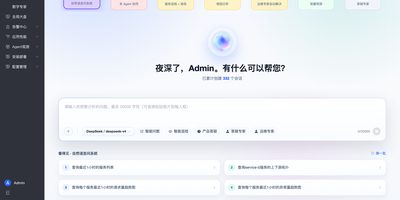
Instead of clicking through charts, you ask DataBuff which service is slowest, and the answer comes straight from live OpenTelemetry traces, metrics, topology, and alerts. The AI Brain runs query and inspection experts in parallel and merges their findings into one forwardable report. Global topology turns failing services red, and service flow shows who calls whom, down to databases, caches, and queues. Click a latency spike to open the matching traces, then read the span waterfall to find the slowest span. The Slow SQL tab ranks statements by call count, and error analysis groups failures by exception type. Alert rules apply thresholds or change detection to error rate, latency, or request count, and alerts resolve themselves when metrics recover. Any alert shows related traces and logs, offers AI root-cause analysis, and can post JSON to a webhook. Telemetry arrives over OTLP from OpenTelemetry SDKs, Collectors, Nginx, or an eBPF DaemonSet, and SkyWalking agents connect through their native gRPC. Cursor and Claude Code call 15 platform tools over MCP, and Prometheus, SkyWalking, or Zabbix join custom digital experts. A key under Model Settings switches the AI on, with Kimi, DeepSeek, GLM, Ollama, or other OpenAI-compatible endpoints behind it. One Docker command installs ingest, storage, and the web platform, with Kubernetes and offline installs also available. Running on a dedicated VPS on RepoCloud with guaranteed CPU, RAM, and SSD, full root SSH access, and a browser serial console. AGPL-3.0 licensed.
UptimeKit
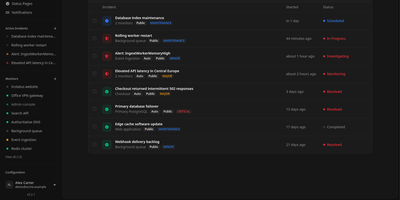
UptimeKit watches your services from several regions at once and publishes the verdict on a status page your customers can actually read. A central dashboard assigns checks to worker probes that run them on schedule, covering HTTP and HTTPS, TCP, ICMP ping, DNS, keyword matches, and JSON responses. Monitors are sorted into nested groups and tags, and HTTPS targets get automatic certificate expiry tracking. When something breaks, an incident takes shape with severity, status transitions, comments, and a resolution flow, either from the dashboard or from a Prometheus AlertManager alert. Status pages come in multiple flavors: public, password protected, or tied to a custom domain, with themes, uptime history bars, and email subscribers who hear about every update. Notifications reach Discord, Google Chat, Telegram, ntfy, Apprise, and plain webhooks. Organizations with roles keep several teams in one installation, and OIDC single sign-on connects the login to an existing identity provider. Response time charts break latency into percentiles per region over any period you pick. A planned maintenance window announces itself on the status page before it begins. Running on a dedicated VPS on RepoCloud with guaranteed CPU, RAM, and SSD, full root SSH access, and a browser serial console. MIT licensed.
Grafana Loki
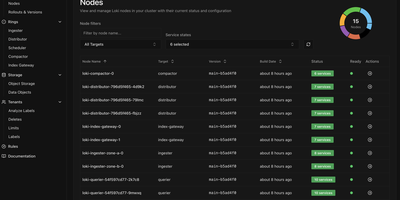
With over 28,600 GitHub stars and 450 contributors, Grafana Loki is the log aggregation system that takes the Prometheus approach to logging — indexing only metadata labels instead of full log content, making it dramatically cheaper and simpler to operate than traditional log management platforms. The label-based indexing strategy groups log streams using the same labels already applied to Prometheus metrics, enabling seamless switching between metrics and logs in Grafana dashboards without maintaining separate indexing infrastructure. Grafana Alloy, the telemetry collector replacing Promtail, scrapes and pushes logs with Prometheus-style service discovery, automatic Kubernetes Pod label extraction, and pipeline stages for parsing, filtering, and relabeling before ingestion. LogQL, the query language, combines label matchers for stream selection with regex line filters and aggregation functions, supporting rate calculations, pattern parsing, and metric generation from log data for alerting and dashboard panels. The storage architecture writes compressed log chunks and TSDB indexes to S3, GCS, Azure Blob Storage, or MinIO-compatible object stores, with configurable retention and compaction policies. Deployment modes scale from a single binary for development through monolithic high-availability mode with multiple replicas to full microservices decomposition with separate ingester, distributor, querier, query-frontend, compactor, and ruler components on Kubernetes via Helm charts. Multi-tenancy isolates data and query paths per tenant through header-based tenant ID assignment. Running on a dedicated VPS on RepoCloud with guaranteed CPU, RAM, and SSD, full root SSH access, and a browser serial console. AGPL-3.0 licensed.

RocketplaneIO
RocketplaneIO is a self-hosted AI SRE platform that gives Kubernetes clusters zero-instrumentation eBPF observability plus a copilot capable of safely diagnosing and fixing issues without your telemetry ever leaving your infrastructure. Point it at any cluster, and an eBPF DaemonSet starts capturing HTTP, gRPC, SQL, Redis, and Kafka spans across every service, including compiled binaries, with cross-service context propagation and no code changes required. The live service map draws itself from actual network traffic, matching technology logos from container images and coloring each node's health from RED metrics. Every log line sits two clicks from its parent distributed trace, and a PromQL query engine, embedded from the real Prometheus evaluator, runs over ClickHouse for long-term metric retention. The complete Kubernetes inventory (Services, Ingress, ConfigMaps, network policies, persistent volumes, CRDs) syncs continuously and is searchable alongside traces and logs. When the copilot identifies a problem, it picks from a catalog of roughly 30 risk-classified safe actions; each action verifies its preconditions, captures a before-state snapshot, executes, checks the result, and rolls back automatically on failure. Disruptive operations pause for explicit human approval before proceeding. An MCP endpoint exposes the identical guardrailed toolbox to external AI agents, so Claude Code or Cursor can operate the cluster through the same safety boundary the browser copilot uses. Complex remediations compose as searchable, forkable Starlark workflows that compile deterministically at save. Running on a dedicated VPS on RepoCloud with guaranteed CPU, RAM, and SSD, full root SSH access, and a browser serial console. Apache-2.0 licensed.
Vigil
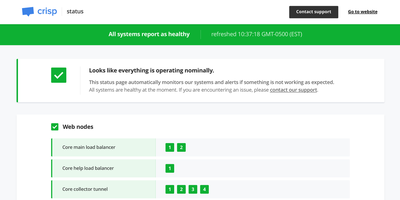
Vigil monitors your entire distributed infrastructure and generates a public status page from a single Rust binary small enough to run on a Raspberry Pi, consuming minimal CPU and memory while providing crash-free reliability. Four distinct monitoring modes cover every topology: poll probes check HTTP, TCP, SSH, and ICMP endpoints for reachability with configurable intervals and thresholds; push probes receive health reports from Vigil Reporter libraries embedded in your application code across Node.js, Python, Golang, Rust, TypeScript, Dart, and C#; local probes delegate monitoring to Vigil Local slave daemons running behind firewalls on separate LANs; and script probes execute custom shell commands for specialized health checks. Each monitored service transitions through healthy, sick, and dead states based on consecutive probe failures, with configurable thresholds controlling state transition sensitivity. When services change state, Vigil dispatches notifications through twelve alert channels including Slack, Email, Twilio SMS, Telegram, Pushover, Gotify, XMPP, Matrix, Zulip, Cisco Webex, and generic webhooks. The generated status page displays service groups organized by category with real-time replica status, system load metrics from reporter probes, and a maintenance announcement system for communicating planned downtime through the Manager HTTP API. Configuration uses a single TOML file defining all probes, services, and notification channels with no database dependency. Docker deployment pulls the official image with volume-mounted configuration. Running on a dedicated VPS on RepoCloud with guaranteed CPU, RAM, and SSD, full root SSH access, and a browser serial console. MPL-2.0 licensed.
QuestDB
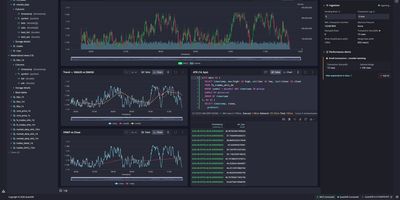
Powering trading floors at firms processing millions of market data events per second and trusted by organizations including Airbus, Yahoo, and Copenhagen Atomics, QuestDB has earned over 17,000 GitHub stars as the time-series database that refuses to make you choose between ingestion speed and query latency. The column-oriented, time-partitioned storage engine processes millions of rows per second on ingest through write-ahead logging with instant durability, while SIMD-accelerated parallel execution returns analytical queries over billions of rows in milliseconds. Time-series SQL extensions add ASOF JOIN for point-in-time lookups across tables with misaligned timestamps, SAMPLE BY for downsampling at arbitrary time intervals, LATEST ON for last-value queries, and WINDOW JOIN for sliding window aggregations — all through standard SQL syntax accessible via the PostgreSQL wire protocol, REST API, or the QuestDB Wire Protocol (QWP) that streams Apache Arrow at 220 million rows per second. Multi-tier storage automatically moves data from the WAL through native columnar format to Parquet files on S3-compatible object storage, keeping hot data fast and cold data portable without manual tiering. The built-in web console provides an interactive SQL editor with syntax highlighting, autocomplete, and charting for quick data exploration. Views, materialized views, and n-dimensional arrays support real-time analytics, while native Parquet export enables direct integration with Python, DuckDB, and AI/ML frameworks. Running on a dedicated VPS on RepoCloud with guaranteed CPU, RAM, and SSD, full root SSH access, and a browser serial console. Apache 2.0 licensed.
UptimeKuma
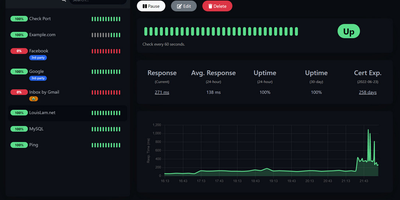
Sixty-thousand-plus GitHub stars make Uptime Kuma the most popular self-hosted monitoring tool - MIT-licensed, Node.js, and the standard replacement for UptimeRobot, Pingdom, and Freshping. It watches a dozen monitor types: HTTP(S) endpoints with keyword and JSON-query content validation, TCP ports, ICMP ping, DNS records, WebSockets, Docker containers via the socket, Steam game servers, MQTT brokers, gRPC services, and push-based heartbeats for cron jobs and internal workers. Checks run at intervals as tight as 20 seconds - versus UptimeRobot's 5-minute free tier - with unlimited monitors and unlimited data retention. When something fails, alerts fan out through 90+ notification channels: Slack, Discord, Telegram, email with LiquidJS templating, PagerDuty, OpsGenie, ntfy, Gotify, Matrix, and dozens more via native providers plus the Apprise library. Unlimited public or password-protected status pages - mappable to specific domains and organized into monitor groups - communicate health to customers, with maintenance windows that suppress alerts during planned work. The reactive dashboard graphs response times, tracks SSL certificate expiry with advance warnings, supports proxies and 2FA, and ships in dozens of languages. One Docker container with a SQLite volume covers an entire infrastructure.
TapMap
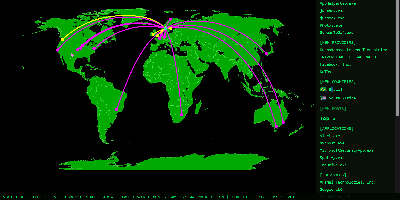
TapMap draws a computer's live network connections on an interactive world map, so you can watch which applications are talking to which services, where those services sit, and what normal looks like for that machine. A local pipeline scans active sockets, extracts the remote addresses, and enriches them with geolocation from databases stored on the machine itself. Every connection carries the owning application or process, its network operator, and the operating system's verification status for that app, and places that share a location are highlighted when connections overlap. The same view lists local open ports, both TCP listeners and bound UDP sockets, established services on your LAN, and public services whose location could not be mapped. A rolling 30-day history turns raw connections into awareness: an Insights panel surfaces new applications, providers, countries, and ports, plus the most frequent activity, while a Significant Connections log records first sightings and failed verifications. A Daily Activity Report goes further, sorting applications into seen-once, occasional, recurring, and stable patterns, analyzing provider concentration, and charting country activity with detailed timelines. New significant connections can raise a desktop notification or publish to an MQTT broker you configure. Nothing is sent anywhere by default: processing happens locally, with no telemetry. Running on a dedicated VPS on RepoCloud with guaranteed CPU, RAM, and SSD, full root SSH access, and a browser serial console. MIT licensed.