Categories
Self-Hosted DevOps Infrastructure Observability Alerting Incident Management Status Page Uptime MonitoringStars
Forks
Watchers
Developer links
UptimeKit
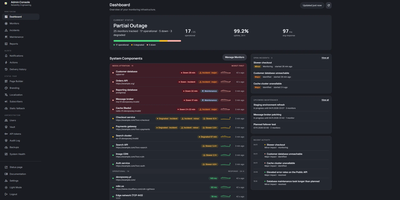
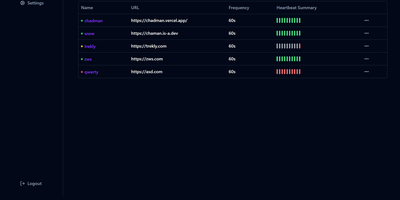
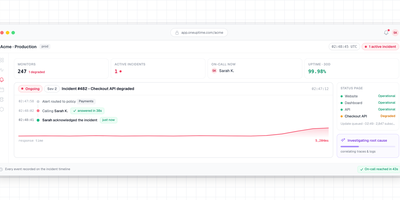
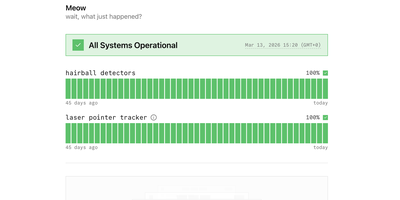
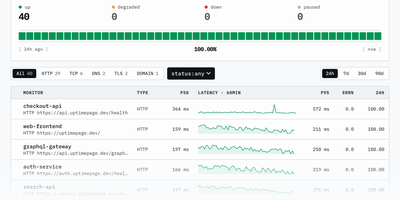
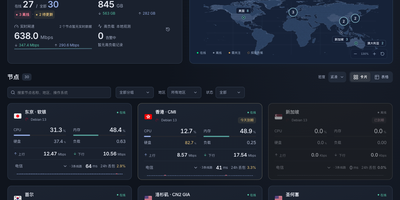
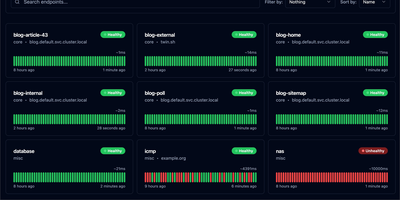
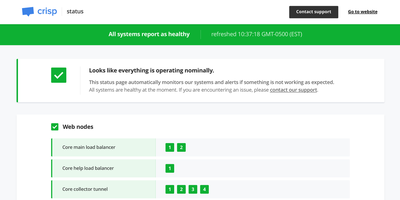
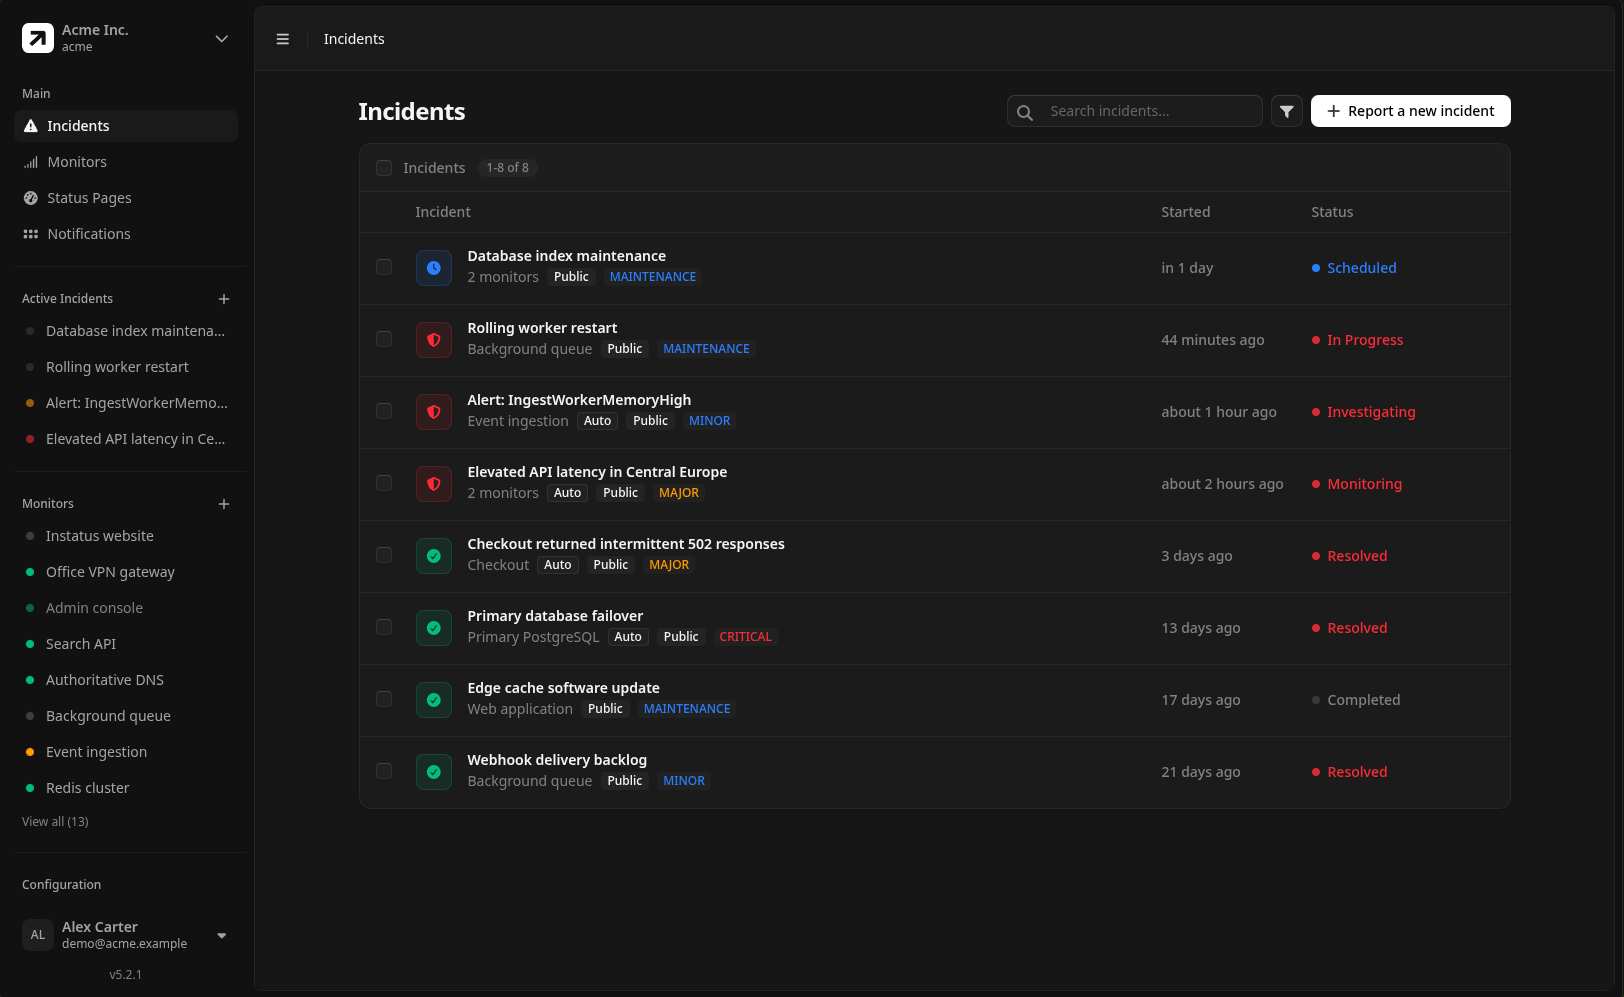
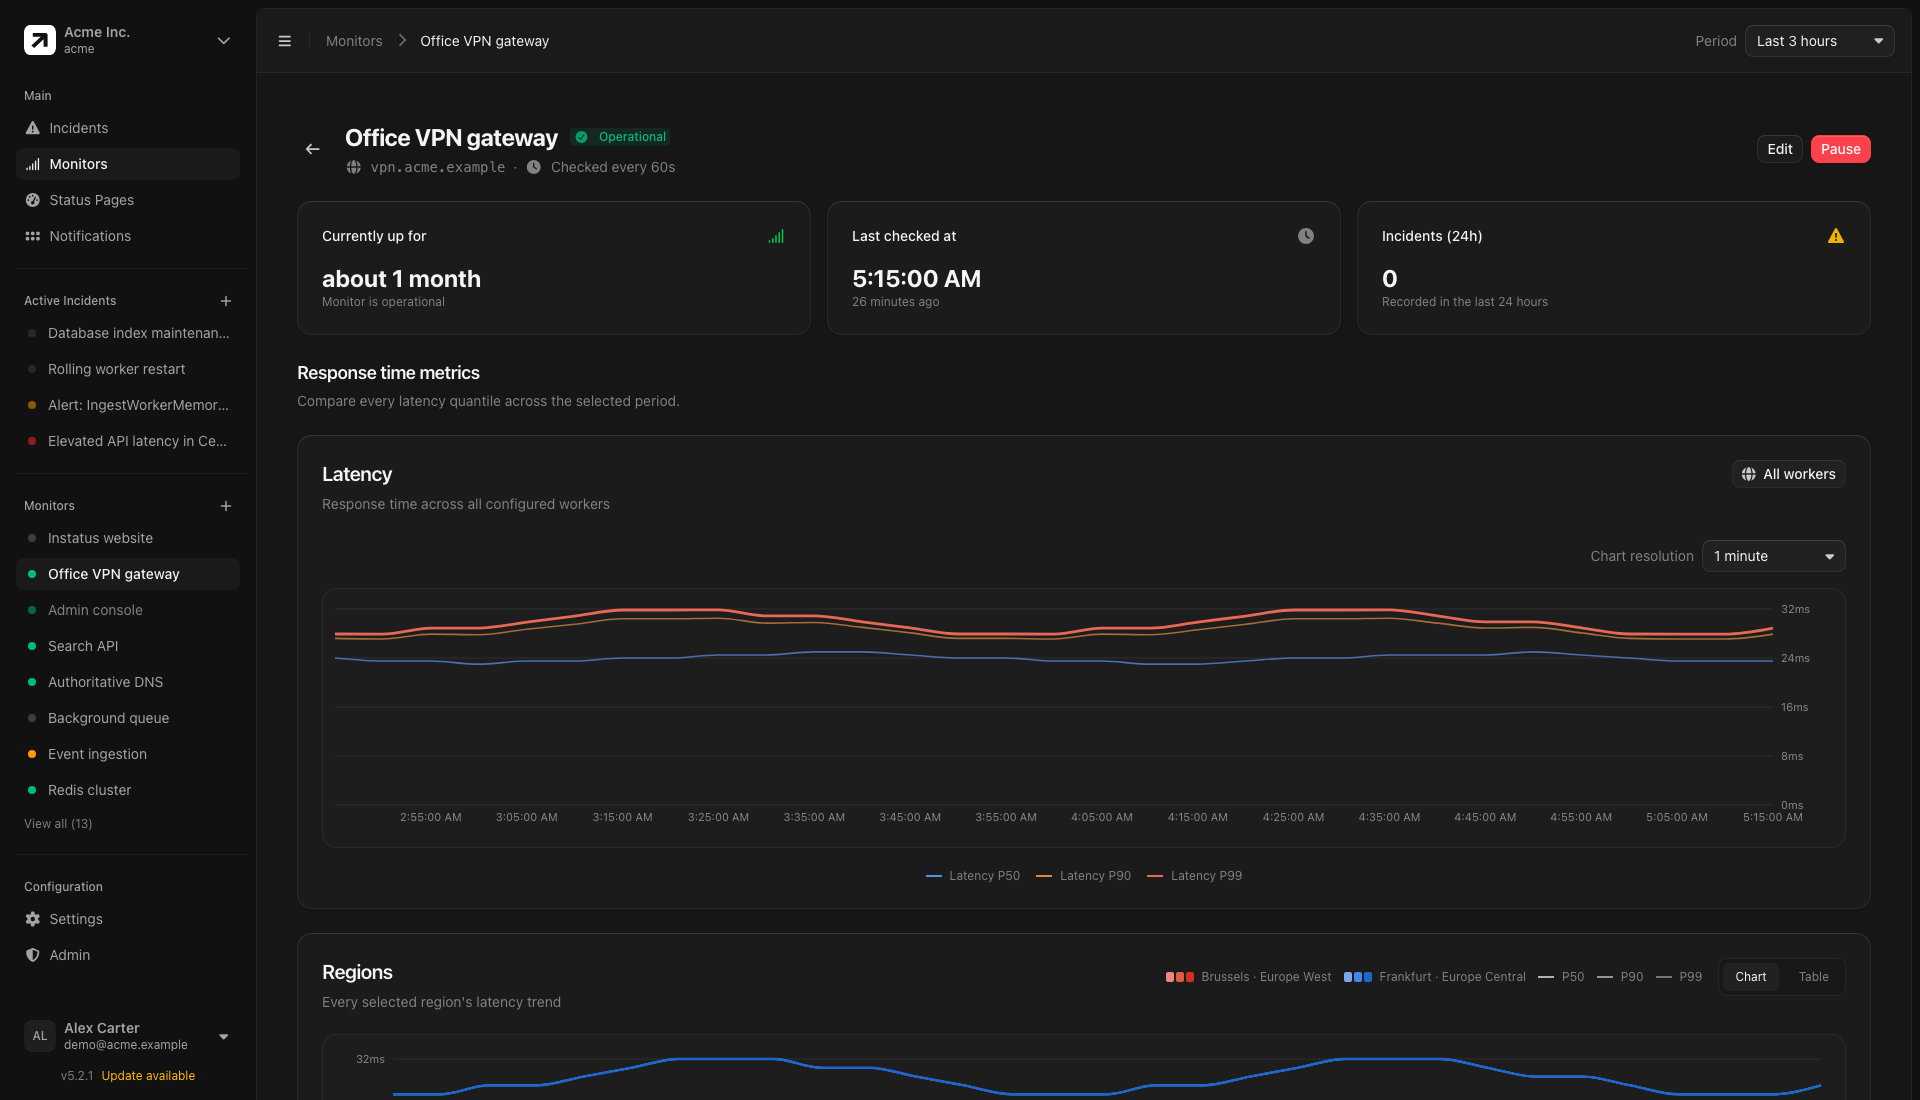
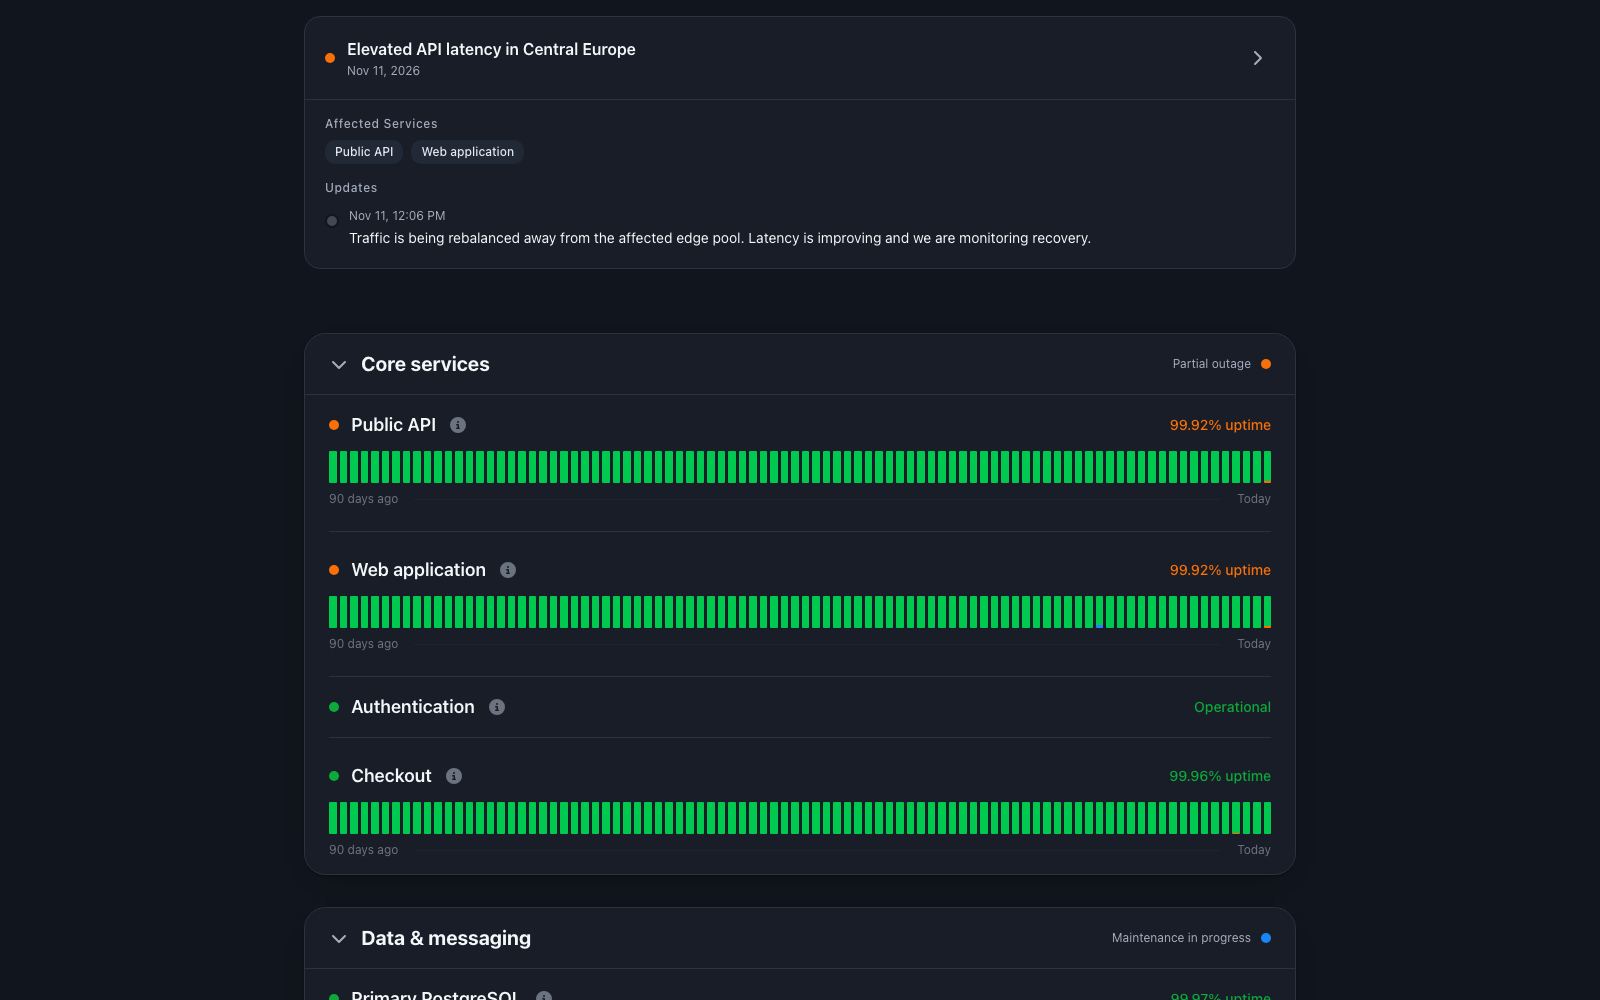
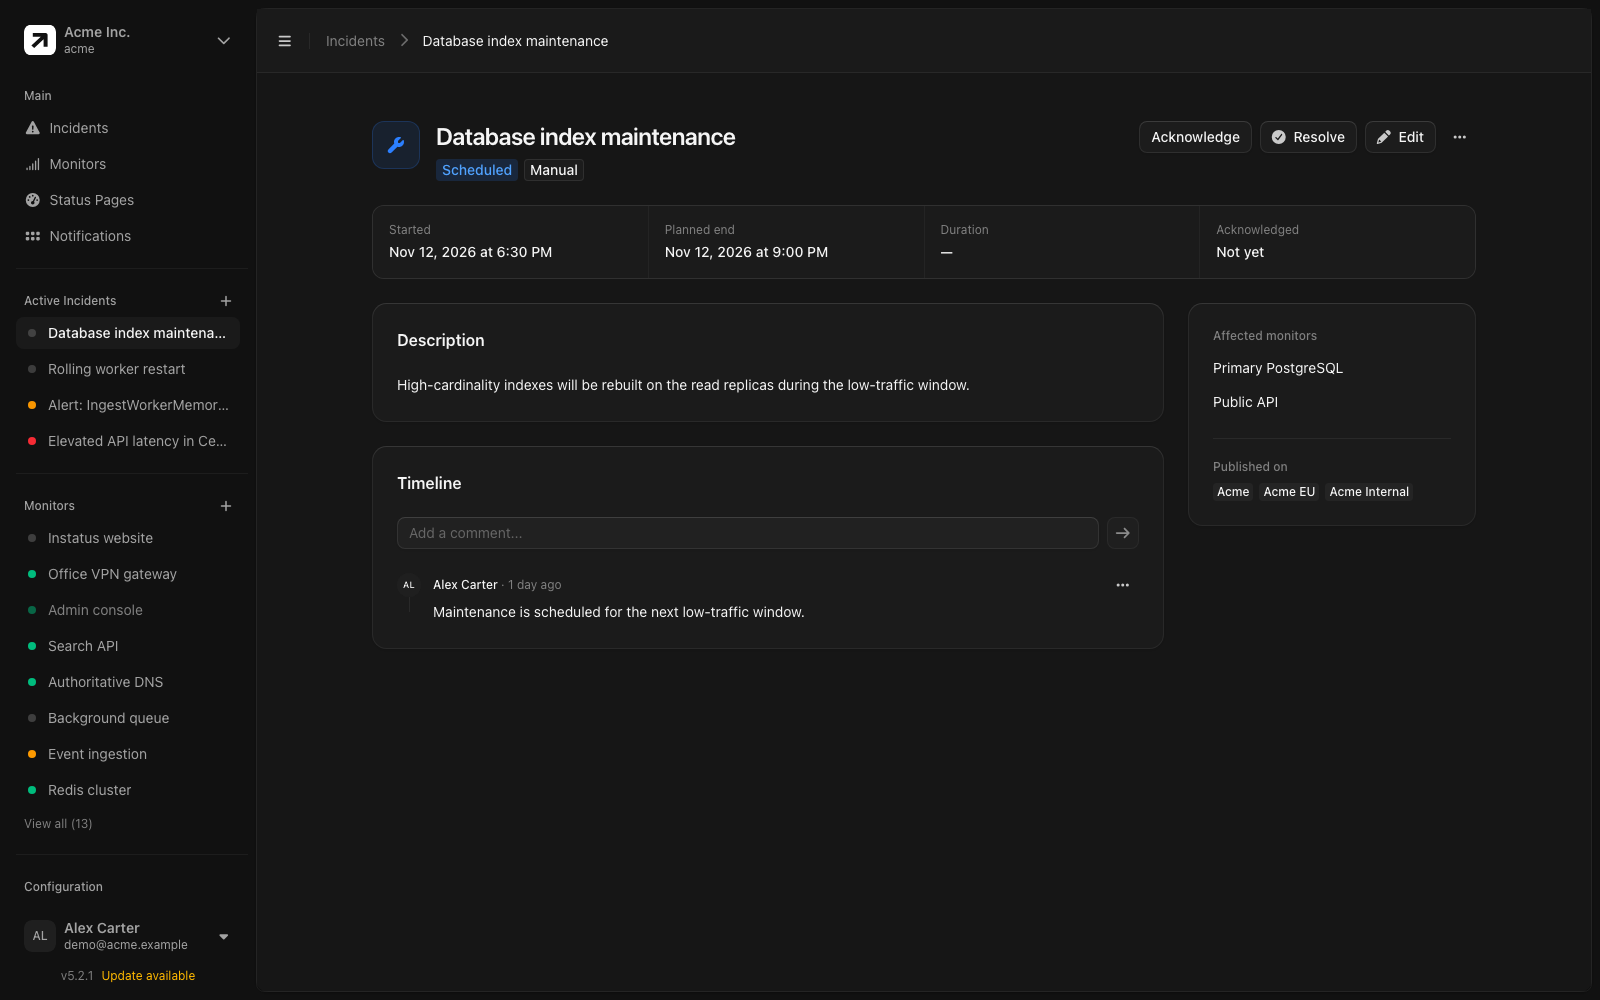
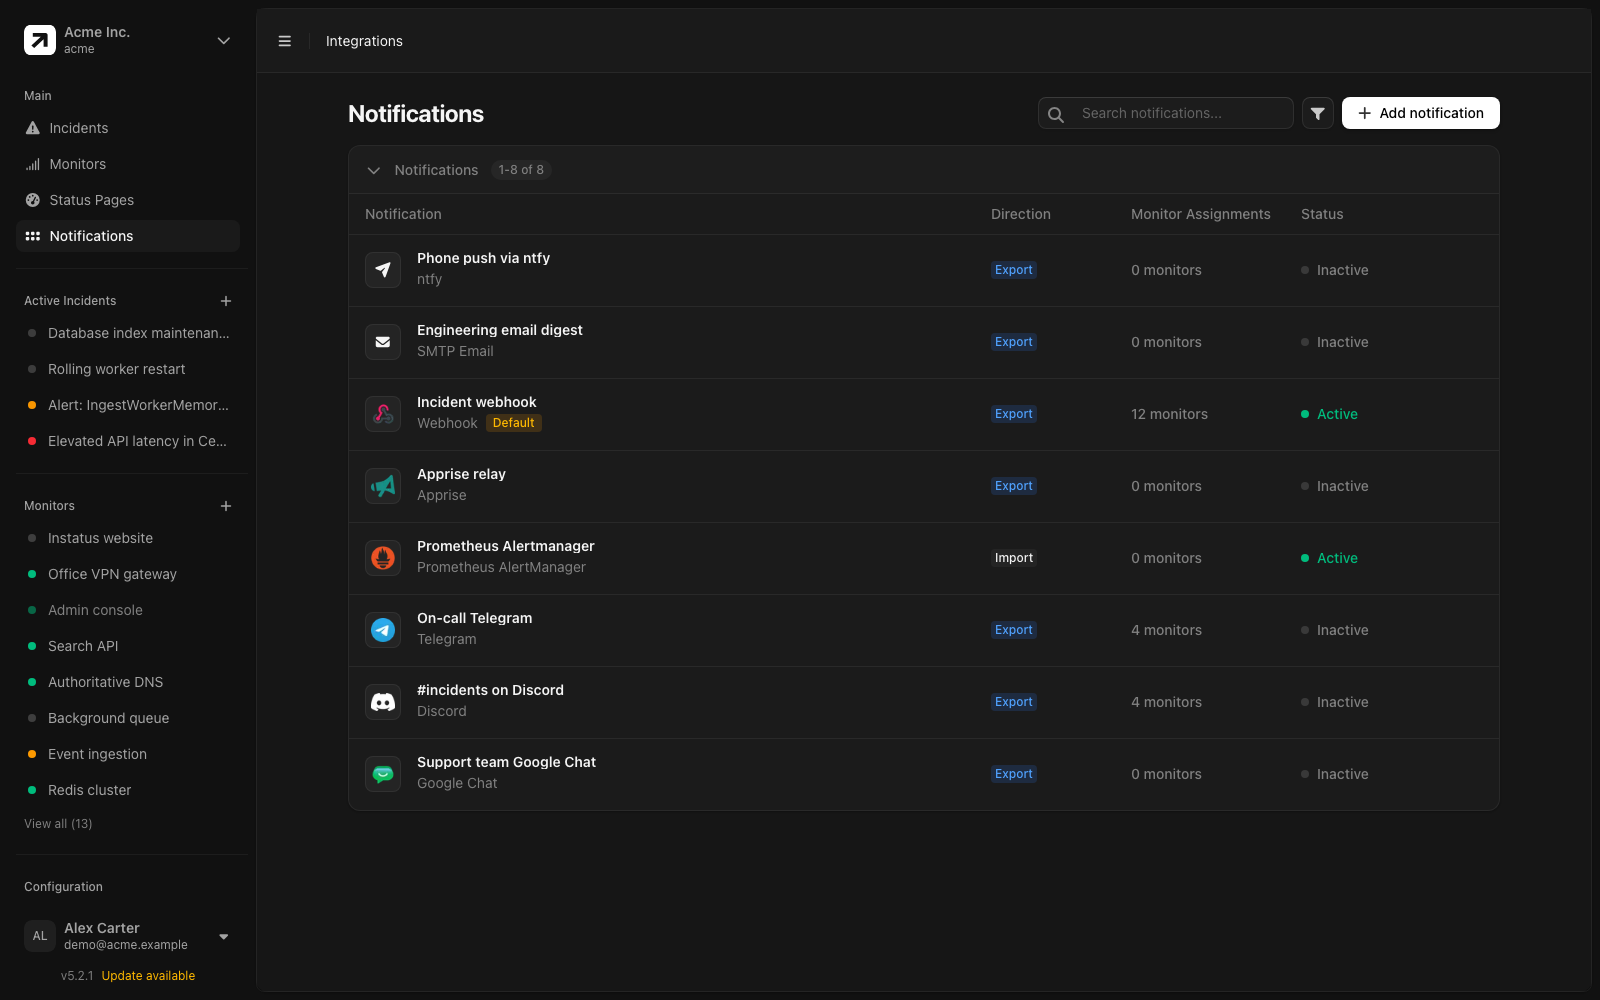
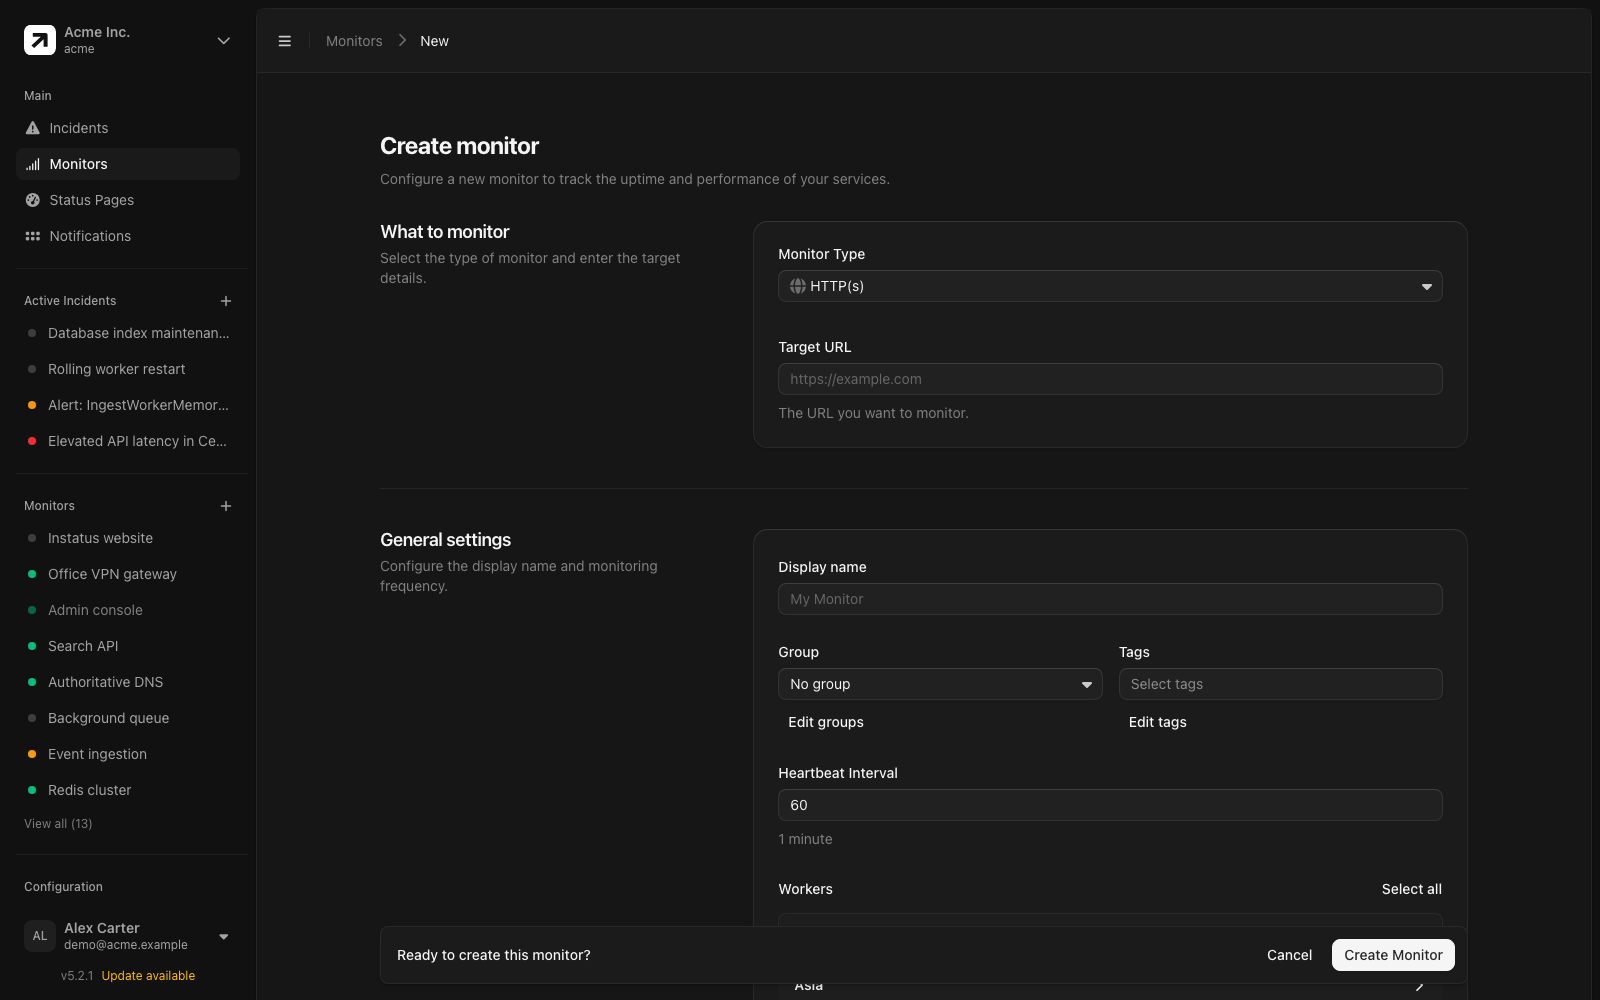
UptimeKit watches your services from several regions at once and publishes the verdict on a status page your customers can actually read. A central dashboard assigns checks to worker probes that run them on schedule, covering HTTP and HTTPS, TCP, ICMP ping, DNS, keyword matches, and JSON responses. Monitors are sorted into nested groups and tags, and HTTPS targets get automatic certificate expiry tracking. When something breaks, an incident takes shape with severity, status transitions, comments, and a resolution flow, either from the dashboard or from a Prometheus AlertManager alert. Status pages come in multiple flavors: public, password protected, or tied to a custom domain, with themes, uptime history bars, and email subscribers who hear about every update. Notifications reach Discord, Google Chat, Telegram, ntfy, Apprise, and plain webhooks. Organizations with roles keep several teams in one installation, and OIDC single sign-on connects the login to an existing identity provider. Response time charts break latency into percentiles per region over any period you pick. A planned maintenance window announces itself on the status page before it begins. Running on a dedicated VPS on RepoCloud with guaranteed CPU, RAM, and SSD, full root SSH access, and a browser serial console. MIT licensed.
Benefits
- Checks From Multiple Regions
- Separate worker probes run monitors from different locations, so a regional network problem shows up as degraded service instead of a false full outage.
- Status Pages Customers Trust
- Publish public or password protected pages on your own domain with uptime history, incident timelines, and email subscribers who receive every status change.
- Clear Incident Handling
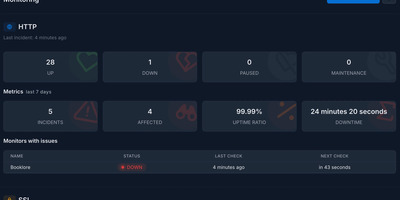
- Incidents carry severity, status steps, and comments, giving the whole team one timeline to follow from first alert to resolution and a public summary.
- Alerts Where Teams Already Work
- Discord, Telegram, Google Chat, ntfy, Apprise, webhooks, and Prometheus AlertManager are built in, so notifications land in the channels people already watch.
Features
- Six Monitor Types
- Check HTTP and HTTPS, TCP ports, ICMP ping, DNS records, response keywords, and HTTP JSON values at configurable intervals.
- Groups, Tags, And SSL
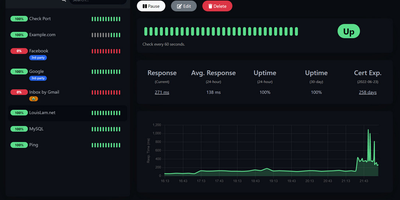
- Organize monitors into nested groups with tags, and track HTTPS certificate expiry automatically with warnings before they lapse.
- Themed Status Pages
- Build several status pages with custom domains, password protection, themes, and 90-day uptime bars that show each service at a glance.
- Latency Charts By Region
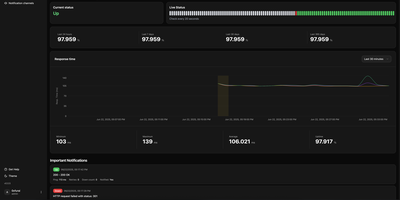
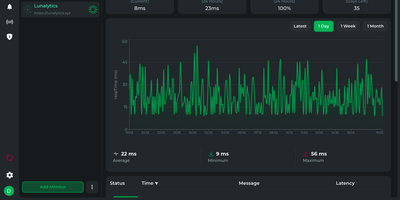
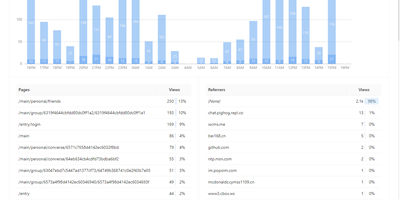
- Inspect P50, P90, and P99 response times per worker region across selectable periods, backed by TimescaleDB or ClickHouse storage.
- Teams And Single Sign-On
- Invite colleagues into organizations with roles, and connect OIDC providers so logins follow your existing identity setup.
- Scheduled Maintenance Windows
- Plan maintenance in advance, attach affected monitors, and show the upcoming window on selected status pages.