Bugsink
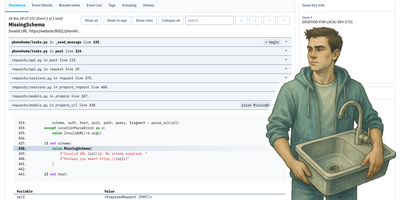
Bugsink has earned over 1,800 GitHub stars as the lightweight self-hosted error tracking platform that replaces Sentry without per-event billing by accepting error reports from any Sentry-compatible SDK across Python, JavaScript, Node.js, Ruby, Java, PHP, Go, and every other language Sentry supports. Simply update the DSN in your existing Sentry configuration and Bugsink captures the same stack traces, local variables, request context, and breadcrumbs that Sentry processes, displayed through a focused interface designed for debugging rather than dashboarding. Automatic issue grouping collapses duplicate error events into single actionable issues based on exception type, message, and stack frame context, turning thousands of raw events into a manageable list. Issue status tracking supports resolved, resolved-in-next-release, and muted states with automatic regression detection when resolved issues recur. Release tracking associates events with deploy versions to correlate error spikes with specific rollouts. Tag-based search filters issues by environment, release, user, browser, operating system, or any custom key-value pair sent by the SDK. Alerting notifies your team through Slack, Discord, Mattermost, and email when new issues appear or resolved issues regress, with per-project webhook configuration and user-level notification preferences. Per-project retention policies with automatic event eviction manage storage growth. A REST API with OpenAPI documentation enables custom integrations and dashboards. Source map support links minified JavaScript to original source. Deploy via Docker with the bugsink/bugsink image. Running on a dedicated VPS on RepoCloud with guaranteed CPU, RAM, and SSD, full root SSH access, and a browser serial console. PolyForm Shield licensed.
Sentry
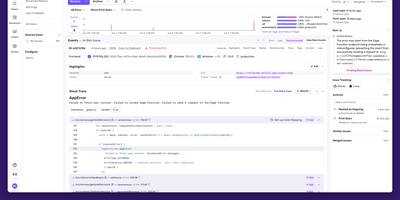
Backed by 44,000 GitHub stars and trusted by over four million developers, Sentry is the debugging platform that captures errors, traces, replays, profiles, and metrics from your applications and connects them all through distributed tracing. The error tracking engine captures full stack traces with source context, breadcrumbs, and automatic demangling for native crashes, while intelligent grouping consolidates duplicate events into actionable issues with regression detection and automatic assignment. Performance monitoring instruments your frameworks automatically, capturing every database query, API call, cache hit, and queue operation as spans within distributed traces that flow across frontend, backend, and mobile boundaries. Session Replay produces video-like recordings of real user sessions showing DOM interactions, network requests, console messages, and errors on a synchronized timeline, with AI-powered summaries that describe what happened without watching the full replay. Continuous profiling captures CPU execution data at the function and line level for Node.js, Python, iOS, and Android, linking slow spans directly to the exact code responsible. Cron monitoring tracks scheduled jobs for failures, missed runs, and duration anomalies. The alerting engine fires notifications through Slack, PagerDuty, Opsgenie, and webhooks on new issues, regressions, error spikes, or when latency and crash-free session rate thresholds are crossed. Self-hosted deployment runs as a Docker Compose stack with PostgreSQL, ClickHouse, Kafka, Redis, and Relay. Running on a dedicated VPS on RepoCloud with guaranteed CPU, RAM, and SSD, full root SSH access, and a browser serial console. FSL licensed.
Temps
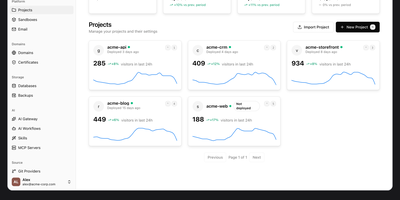
Consolidate application hosting, web analytics, error tracking, and performance monitoring into Temps, an open-source developer platform that replaces disparate SaaS subscriptions with a single compiled Rust binary. Engineering teams deploy full-stack web applications, background daemons, and microservices directly from Git repositories with automated TLS certificate provisioning powered by an embedded Cloudflare Pingora reverse proxy. The centralized web console unifies real-time visitor analytics, conversion funnels, and rrweb-powered session replay recordings without third-party tracking scripts. Integrated error monitoring ingests runtime exceptions with full stack traces and source map resolution, while continuous health checks evaluate container CPU utilization, memory thresholds, and network throughput across custom alerting rules. Developers manage infrastructure through an extensive command line interface containing over 440 operations across 69 command groups, or deploy drop-in skill files that allow AI coding assistants like Claude Code and Codex to provision preview environments autonomously. The platform also provides serverless key-value storage, S3-compatible blob buckets, and native transactional email routing with custom DKIM validation. Running on a dedicated VPS on RepoCloud with guaranteed CPU, RAM, and SSD, full root SSH access, and a browser serial console. Apache 2.0 licensed.
Swetrix
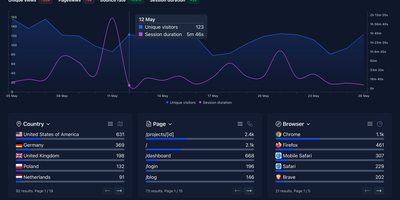
Traffic analytics, real-user performance monitoring, and client-side error tracking - normally three tools - in one cookieless, privacy-first dashboard: Swetrix. The Community Edition ships the same core engine as the cloud product - a NestJS API with ClickHouse for high-volume event storage, MySQL for relational data, and Redis for caching, fronted by a React dashboard and a ~5 KB tracking script with official packages for 20+ frameworks including Next.js, WordPress, and Shopify. Traffic analytics cover pageviews, referrers, UTM campaigns, geolocation, sessions with page flows, funnels, and custom events - all anonymized server-side with no cookies, no cross-device tracking, and no consent banner required for GDPR compliance. Performance monitoring records real-user metrics per pageview: TTFB, DNS and TLS timing, and render times, so regressions surface in the same place as traffic. Error tracking captures unhandled JavaScript exceptions automatically with formatted stack traces, filename/line metadata, affected browsers and pages, first/last-seen timestamps, and a resolve workflow - replacing a separate error monitoring subscription for many teams. Alerts fire to email, Slack, Telegram, Discord, or webhooks on traffic spikes, new errors, and custom events. If Plausible covers your traffic questions but you also want to know why the site broke, Swetrix answers both.
Highlight
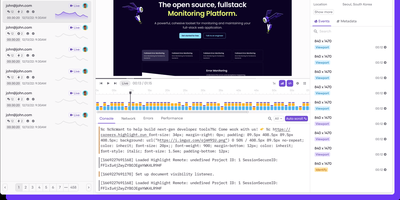
With over 9,000 GitHub stars and a focus on developer experience over legacy monitoring complexity, Highlight.io delivers a unified observability platform that correlates frontend user behavior with backend performance data in a single interface. The session replay engine captures high-fidelity DOM recordings showing exactly what users experienced, including console logs, network requests, page transitions, and user interactions, with configurable privacy redaction for sensitive content. Error monitoring automatically groups and deduplicates errors, surfaces affected user sessions, and provides full stack traces with source map support for minified production code. The logging pipeline ingests structured and unstructured logs from any backend service with automatic property extraction, full-text search, and configurable alerting thresholds. Distributed tracing tracks request flows across microservices with embedded links to associated sessions, errors, and logs for complete request lifecycle visibility. The metrics system collects custom application metrics alongside built-in web vitals and performance data for trend analysis and anomaly detection. Search across all telemetry types uses a unified query language with automatic attribute discovery and saved views for recurring investigations. Integrations connect with Slack, Discord, Linear, Jira, Vercel, and dozens of other developer tools for notification routing and workflow automation. SDKs cover React, Next.js, Vue, Angular, Python, Go, Ruby, Java, PHP, and Elixir with framework-specific instrumentation. Self-hosted deployment runs via Docker Compose with ClickHouse for analytics storage. Running on a dedicated VPS on RepoCloud with guaranteed CPU, RAM, and SSD, full root SSH access, and a browser serial console. Apache 2.0 licensed.
Exceptionless
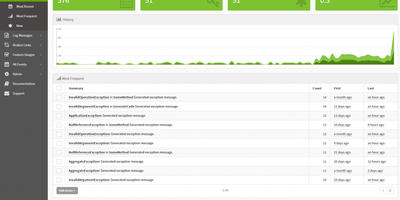
Exceptionless has earned over 2,400 GitHub stars and has been processing production errors since 2014 as the real-time event monitoring platform that captures far more than crashes. Built with ASP.NET Core on Elasticsearch for storage and Redis for caching, Exceptionless ingests exceptions, log messages, feature usage events, broken links, and custom event types through official SDKs for JavaScript, Node.js, .NET Core, ASP.NET, WPF, Web API, WebForms, Console apps, and React Native. Automatic event stacking groups related occurrences by exception type, message, and call stack into single actionable items, while manual stacking keys let developers create custom groupings for specific features or workflows. The real-time dashboard displays Most Frequent, Most Recent, and New event views with filtering by project, date range, environment, and custom tags. Stack management tracks resolution status with version-aware regression detection that automatically reopens resolved issues when the same error surfaces in a newer release. Webhook integrations connect to Slack, Discord, and external services through Zapier for automated issue tracking in GitHub Issues and Jira. Per-project notification settings control email and chat alerts for new errors, regressions, and critical events. OpenTelemetry support captures distributed traces alongside error data. The v8.6.0 release introduced a hosted Model Context Protocol server at the /mcp endpoint, enabling AI tools to query error data via OAuth-authenticated access. Deploy via Docker with the exceptionless/exceptionless image alongside Elasticsearch and Redis. Running on a dedicated VPS on RepoCloud with guaranteed CPU, RAM, and SSD, full root SSH access, and a browser serial console. Apache 2.0 licensed.
Moneat
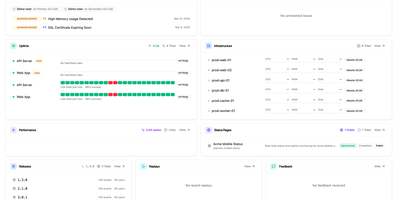
Moneat is the open-source observability platform that unifies error tracking, session replay, performance monitoring, logging, uptime checks, synthetics, product analytics, and AI observability into a single self-hosted application — replacing Sentry, Datadog, and Statuspage with one deployment. The Sentry SDK compatibility layer accepts data from @sentry/browser, @sentry/node, @sentry/react, @sentry/nextjs, sentry-sdk for Python, sentry-kotlin, sentry-java, sentry-android, sentry-cocoa, sentry-go, sentry-ruby, and Sentry.NET by updating one DSN endpoint. Datadog Agent compatibility redirects existing fleets by setting dd_url, and native OpenTelemetry OTLP ingestion accepts logs, traces, and metrics from any exporter or Collector. Error monitoring groups exceptions with smart deduplication, session replay records DOM-based user interactions linked to errors, distributed tracing visualizes transaction and span breakdowns with live service maps, and continuous profiling renders flamegraphs in pprof, JFR, and Sentry formats. Uptime monitoring runs HTTP, TCP, and ping checks with public status pages, while synthetics executes API tests, multi-step workflows, SSL checks, and DNS probes. Custom dashboards support drag-and-drop widgets with Grafana import, product analytics provides funnels and retention cohorts, release tracking surfaces crash-free rates with source map upload, and AI observability traces LLM calls end to end. Built on Kotlin and Java with ClickHouse for analytical storage, PostgreSQL for relational data, and Redis for caching, deployment uses Docker Compose with an interactive installer automating secrets and service orchestration. Running on a dedicated VPS on RepoCloud with guaranteed CPU, RAM, and SSD, full root SSH access, and a browser serial console. AGPL-3.0 licensed.
GlitchTip
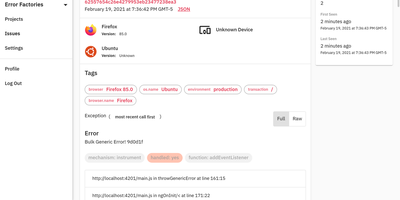
GlitchTip speaks Sentry's protocol without Sentry's operational weight - open-source error tracking that your existing SDKs already understand. The pitch is pragmatic: instrument your application with the official Sentry SDKs you already know - any language they cover - and point the DSN at your own GlitchTip instance instead. Errors, exceptions, log messages, and Content Security Policy violations flow into one place for triage, grouped into issues with stack traces, with alerts delivered by email or webhook the moment things break. Where self-hosted Sentry has ballooned into a docker-compose stack of twenty-plus containers, GlitchTip is a deliberately lean Django and PostgreSQL application a small team can actually run. Beyond errors, it bundles three more monitoring concerns: performance monitoring takes a works-out-of-the-box approach - no dashboard building, just your slowest web requests, database queries, and transactions surfaced automatically; uptime monitoring pings your sites and alerts on failures, or runs in reverse as a dead-man's-switch heartbeat for cron jobs that must check in on schedule; and log search puts application logs alongside errors for faster debugging. Unlimited projects and team members, MIT-licensed, built by Burke Software - your event volume is limited only by your own hardware.