Archon
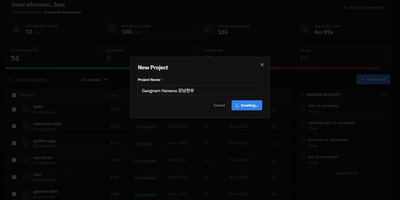
Stop hoping your AI coding assistant remembers to plan before it codes, test after it implements, and review before it ships. Archon wraps Claude Code, OpenAI Codex, and other AI agents inside structured YAML workflows that enforce the same development process every single time. Define your pipeline as a directed acyclic graph of nodes (AI tasks, shell scripts, approval gates, loops) and Archon handles the orchestration: resolving dependencies, running independent nodes in parallel, passing artifacts between steps, and isolating every run in its own git worktree so five bug fixes can proceed simultaneously without conflicts. Ship with 17 pre-built workflows covering everything from "idea to merged PR" to automated conflict resolution, or author your own by committing YAML files to your repository's .archon/workflows/ directory. The web dashboard, launched with archon serve, provides a conversation interface with real-time streaming, a visual drag-and-drop workflow builder for creating DAG pipelines, step-by-step progress monitoring for every run, and a unified sidebar aggregating conversations from CLI, Slack, Telegram, and GitHub into one view. An NLP router parses natural language requests and automatically selects the right workflow. Structured JSON output schemas let you enforce typed responses from AI nodes, with validation and auto-repair for providers that lack native schema support. Every workflow file is version-controlled, portable, and reviewable in pull requests, so your entire team runs identical processes from day one. Running on a dedicated VPS on RepoCloud with guaranteed CPU, RAM, and SSD, full root SSH access, and a browser serial console. MIT licensed.
Rancher
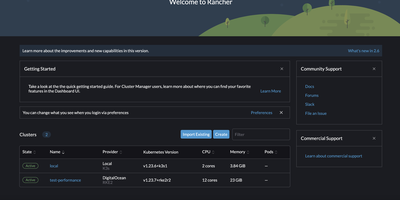
Used by over 30,000 teams and 650+ enterprise customers managing more than 5.2 million containers, Rancher has earned recognition as a Leader in the Gartner Magic Quadrant for Container Management and the Forrester Wave for Multicloud Container Platforms. The platform provides a single pane of glass for provisioning, upgrading, and securing Kubernetes clusters across Amazon EKS, Google GKE, Microsoft AKS, RKE2, K3s, and any CNCF-conformant distribution. Multi-Cluster Management enables centralized authentication via Active Directory, LDAP, SAML, GitHub, and OpenID Connect with granular role-based access control at the cluster, project, and namespace levels. Fleet, the built-in GitOps engine, delivers continuous deployment across hundreds of clusters simultaneously using Helm charts, Kustomize, or raw YAML manifests from any Git repository. The integrated app catalog provides one-click deployment of Prometheus monitoring, Grafana dashboards, Longhorn persistent storage, Istio service mesh, and hundreds of community Helm charts. Rancher supports air-gapped installations for disconnected environments, CIS benchmark scanning for security compliance, and automated backup and restoration of cluster configurations. The dashboard offers real-time workload monitoring, log aggregation, pod shell access, and namespace-scoped resource quotas. Cluster templates enforce organizational standards through Helm-based provisioning policies that ensure consistent configurations across environments. Running on a dedicated VPS on RepoCloud with guaranteed CPU, RAM, and SSD, full root SSH access, and a browser serial console. Apache 2.0 licensed.
Kestra
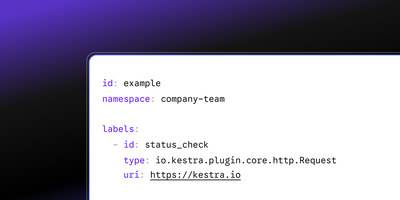
With over 27,000 GitHub stars and an ecosystem of 1,900+ plugins covering every major cloud provider, database, and SaaS platform, Kestra is the orchestration engine that brings Infrastructure as Code principles to workflow automation — defining complex multi-step pipelines in readable YAML that execute across any language, runtime, or infrastructure boundary. The built-in VS Code-style editor provides syntax highlighting, auto-completion, real-time validation, and an AI Copilot that generates workflow YAML from natural language descriptions. Tasks execute in Python, Node.js, Go, R, Shell, SQL, or any Docker container, with event-driven triggers listening for file arrivals on SFTP and cloud storage, messages from Kafka, Redis, Pulsar, AMQP, MQTT, NATS, AWS SQS, Google Pub/Sub, and Azure Event Hubs in real time. The topology view visualizes workflow DAGs with execution state, duration, and output artifacts for each task node. Namespaces organize workflows into isolated environments with configurable secrets, while subflows enable modular composition with inputs, outputs, and conditional branching. Retry policies, timeouts, error handlers, and automatic backfills for missed schedules ensure reliability across production workloads. Git integration pushes workflows directly to branches from the UI with CI/CD pipeline support for automated deployment. The REST API enables programmatic workflow management, execution triggering, and resource provisioning. Running on a dedicated VPS on RepoCloud with guaranteed CPU, RAM, and SSD, full root SSH access, and a browser serial console. Apache 2.0 licensed.
Harbor
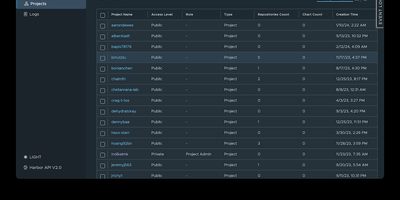
The first container registry to reach CNCF graduated status with over 29,000 GitHub stars since VMware open-sourced it in 2016, Harbor transforms the basic Docker Distribution into a hardened enterprise registry with vulnerability scanning, supply chain signing, multi-datacenter replication, and project-level access control out of the box. Trivy scans every pushed image against the NVD, GitHub Advisory Database, and distribution-specific vulnerability feeds, with scan-on-push policies that block deployment of images exceeding configurable severity thresholds. Artifact signing through Cosign keyless signatures and Notation enforces content trust policies ensuring only cryptographically verified images reach production clusters. Policy-based replication synchronizes images and Helm charts between Harbor instances across multiple datacenters using repository, tag, and label filters with automatic retry and bandwidth throttling — enabling hybrid-cloud and disaster-recovery topologies. The RBAC model isolates projects with per-project quotas, robot accounts for CI/CD automation, webhook notifications, and audit logging that tracks every pull, push, delete, and configuration change. LDAP, Active Directory, and OIDC authentication integrate with existing identity providers, while the proxy cache transparently caches images from Docker Hub, Quay, and other upstream registries to reduce pull latency and rate-limit exposure. The RESTful API with embedded Swagger UI, tag retention policies, garbage collection scheduling, and immutable artifact rules complete the lifecycle management. Deploy via Docker Compose or Helm Chart on Kubernetes. Running on a dedicated VPS on RepoCloud with guaranteed CPU, RAM, and SSD, full root SSH access, and a browser serial console. Apache 2.0 licensed.
Kite
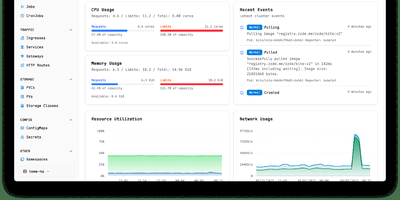
With nearly 3,000 GitHub stars and 14 releases since its June 2025 launch, Kite delivers a lightweight Kubernetes dashboard that replaces the fragmented workflow of switching between kubectl, Lens, and separate monitoring tools with a unified multi-cluster management platform. The dashboard automatically discovers clusters from kubeconfig files and supports independent Prometheus configurations per cluster, providing real-time CPU, memory, and network charts alongside live pod log streaming with filtering and search. A built-in web terminal opens shells directly into pods and nodes without kubectl port-forward, while the Monaco-based YAML editor offers syntax highlighting and validation for in-place resource editing. The integrated AI agent, powered by OpenAI or Anthropic models via native Go SDK integrations, translates natural language into precise client-go API calls — querying cluster health, analyzing pod logs, scaling deployments, patching resources, and cleaning up failed jobs — all operating strictly within the logged-in user's RBAC permissions. Enterprise governance includes OAuth 2.0 single sign-on, multi-factor authentication, FIDO2 passkeys, granular role-based access control with per-namespace permissions, and comprehensive audit logging. Helm chart management enables browsing, installing, and upgrading releases directly from the UI, while the Docker registry integration provides quick image tag selection. Deploy via a single Docker container with SQLite or use the official OCI Helm chart with PostgreSQL or MySQL for production. Running on a dedicated VPS on RepoCloud with guaranteed CPU, RAM, and SSD, full root SSH access, and a browser serial console. Apache 2.0 licensed.
CaddyUI
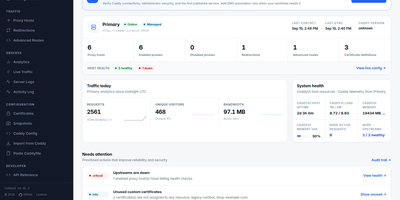
Providing an intuitive control plane for modern reverse proxy infrastructure, CaddyUI enables system administrators to manage proxy hosts, automated TLS certificates, and traffic routing without hand-editing configuration files. Operators can create and adjust reverse proxy destinations, URL path rewrites, custom headers, and redirection rules using structured forms that validate against the proxy engine before saving. The platform coordinates automatic ACME certificate requests and renewals, displaying live certificate expiration timelines, validation stages, and internal self-signed certificate authority options for local network services. Fleet management tools synchronize proxy rules across multiple distributed server instances, preventing configuration drift across staging and production clusters. Automated post-deployment health checks verify upstream endpoint availability, HTTP status codes, and latency thresholds, instantly rolling back to the previous configuration if an expectation fails. An integrated observability suite delivers real-time visitor traffic analytics, geographic maps, HTTP response code breakdowns, and single-click client IP blocking to counter malicious probing attempts. Administrators can schedule automated database backups, configure multi-user access with role permissions, and integrate CrowdSec threat intelligence to protect backends. Running on a dedicated VPS on RepoCloud with guaranteed CPU, RAM, and SSD, full root SSH access, and a browser serial console. Apache 2.0 licensed.
HyperDX
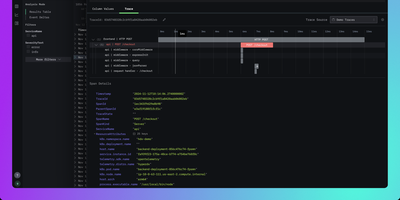
HyperDX correlates logs, metrics, traces, session replays, and errors in a single interface so engineers can resolve production incidents in minutes instead of hours. Nearly 10,000 GitHub stars reflect its role as the integrated UI layer for the ClickStack blueprint endorsed by ClickHouse. The platform connects to any ClickHouse cluster as its storage backend, working with existing table structures without requiring data migration or proprietary ingestion formats. An intuitive Lucene-like search syntax supports full-text queries and property filtering like level:err or service.name:api without needing SQL, while native JSON string querying and event delta analysis surface anomalies in high-cardinality datasets. One-click cross-signal correlation lets you jump from a log line to its distributed trace, from a slow span to associated logs, or from a frontend session replay to the backend errors it triggered. The OpenTelemetry Collector accepts telemetry via OTLP on gRPC port 4317 and HTTP port 4318, supporting automatic instrumentation for Node.js, Python, Java, Go, Ruby, and browser applications. APM tracks HTTP request latency, database query duration, and external service calls with trace waterfall visualizations. Configurable alerts trigger via webhook, Slack, PagerDuty, or email when thresholds are breached. Deploys via Docker Compose with ClickHouse, MongoDB, Redis, and the OpenTelemetry Collector. Running on a dedicated VPS on RepoCloud with guaranteed CPU, RAM, and SSD, full root SSH access, and a browser serial console. MIT licensed.
CapRover
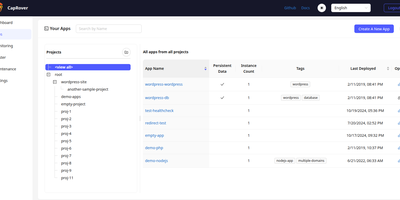
With over 15,000 GitHub stars and nearly nine years of active development, CapRover is the self-hosted PaaS that replaces Heroku's pricing with your own infrastructure while keeping the deploy-and-forget simplicity. The web dashboard manages application lifecycle from deploy through scaling — configure custom domains, environment variables, persistent volumes, instance counts, and nginx templates without touching config files or SSH. The CLI tool enables scriptable deployments with a single command from your terminal or CI/CD pipeline, while webhook-based deployment triggers automated builds from Git pushes. The one-click app marketplace provides over 100 pre-configured services including WordPress, Ghost, PostgreSQL, MySQL, MongoDB, Redis, Grafana, Portainer, and dozens more, each deployed as a Docker container with volumes and environment variables preconfigured. Automatic HTTPS provisions and renews Let's Encrypt certificates for every custom domain with one-click HTTP-to-HTTPS redirects. Under the hood, Docker Swarm orchestrates containers across multiple nodes for horizontal scaling and load balancing, while nginx handles routing with fully customizable EJS-generated configuration templates per application. Deployment supports four methods: CLI push, tarball upload through the web UI, Docker image reference, and Git repository connection. The build system supports Dockerfiles, captain-definition files with build packs, and direct Docker image pulls. NetData integration provides real-time server monitoring dashboards. Running on a dedicated VPS on RepoCloud with guaranteed CPU, RAM, and SSD, full root SSH access, and a browser serial console. Apache 2.0 licensed.
Coder
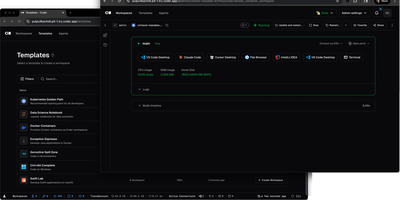
With over 14,000 GitHub stars and enterprise adoption by security-conscious organizations, Coder transforms how development teams provision, manage, and secure their coding environments. Every workspace is defined as a Terraform template, meaning infrastructure engineers can standardize development environments across EC2 instances, Kubernetes pods, Docker containers, or any combination, while developers get self-service provisioning that launches in seconds rather than days of manual setup. The WireGuard-based networking layer establishes encrypted tunnels between developer machines and remote workspaces, providing low-latency access without exposing ports or configuring VPN concentrators. Automatic idle detection shuts down unused workspaces after configurable periods, directly reducing cloud compute costs for organizations running hundreds of developer environments. The Coder Agents feature introduces native AI coding capabilities where the agent loop executes entirely within the control plane on self-hosted infrastructure, keeping LLM API credentials out of individual workspaces and eliminating credential exfiltration risks. Centralized model governance allows platform teams to approve specific AI providers and models, set per-user spend limits, and maintain complete audit logs of all prompts, tool calls, and agent activity. IDE integration supports VS Code through a dedicated extension, JetBrains IDEs via Gateway and Toolbox plugins, and browser-based code-server for web access. The template registry provides pre-built configurations for common development stacks. DevContainer support builds environments from standard devcontainer.json specifications. Deploy on a dedicated VPS on RepoCloud with guaranteed CPU, RAM, and SSD, full root SSH access, and a browser serial console. AGPL-3.0 licensed.
Fleetbase
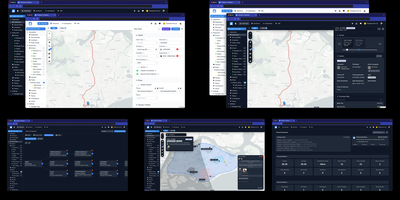
Tracking over 50,000 fleet vehicles across production deployments, Fleetbase delivers a modular logistics operating system where each module—Fleet-Ops, Storefront, Pallet, and Ledger—works independently yet shares a unified data layer that eliminates middleware between ordering, dispatch, warehousing, and accounting. The Fleet-Ops core handles real-time driver tracking through a SocketCluster-based WebSocket event bus, interactive map-based dispatch with both directed and ad-hoc driver assignment, configurable order workflows with custom rules, automation triggers, and activity flows, plus a Kanban-style order board for visual pipeline management. Service zones let dispatchers define geographic operating areas, while proof-of-delivery capture and route optimization close the last-mile loop. The Storefront module provides headless e-commerce with products, carts, and checkout that feed directly into dispatch queues, and the Ledger module records invoices and financial journal entries across all operations. The Navigator driver app—also AGPL-3.0 licensed and fully white-label—delivers turn-by-turn navigation, live order communication, and fault reporting to drivers in the field. The extension architecture pairs backend Laravel Composer packages with frontend Ember Engine modules, enabling third-party developers to build first-class platform extensions without forking. A RESTful API with full documentation, webhook delivery via Redis-backed queues, and push notification support through APNs and FCM round out the integration surface. Running on a dedicated VPS on RepoCloud with guaranteed CPU, RAM, and SSD, full root SSH access, and a browser serial console. AGPL-3.0 licensed.
Keep
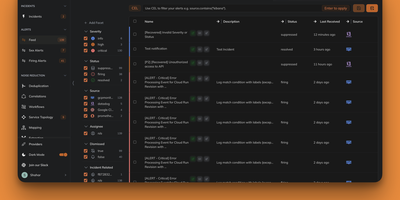
Keep is an open-source AIOps and alert management platform built with Python FastAPI and Next.js. It provides a single pane of glass for monitoring alerts from 110+ integrations, alert deduplication, correlation, enrichment, and filtering, YAML-based workflow automation similar to GitHub Actions, AI-powered correlation and summarization, and customizable dashboards for incident management. With 12,100+ GitHub stars, Y Combinator backing, and an Elastic partnership, Keep is the open-source AIOps platform that centralizes alert management across your entire monitoring stack into a single customizable dashboard. Alert deduplication identifies duplicate notifications across providers, correlation groups related alerts into incidents based on rules or AI-powered semantic analysis using pluggable LLM backends supporting OpenAI, Anthropic, and local models via Ollama, and enrichment adds context from external sources like CMDBs and databases. Workflow automation follows a GitHub Actions paradigm with declarative YAML files defining triggers, conditions, and actions that can query MySQL, update Jira tickets, send Slack messages, execute Python scripts, or call REST APIs. Authentication supports no-auth, database, Auth0, Keycloak, OAuth2 Proxy, Okta, and OneLogin. The Common Expression Language enables advanced alert querying, slicing, and rule-based grouping to reduce noise. On RepoCloud, deploy Keep on a dedicated VPS with Docker Compose, root SSH access, and complete control over your alert infrastructure, all under the MIT license.
Certimate
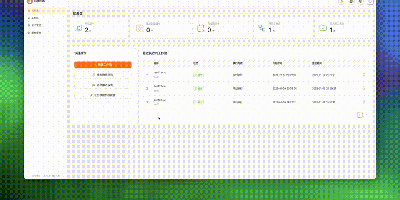
Automate your entire SSL and TLS lifecycle with Certimate, an infrastructure-grade certificate management platform that handles domain verification, ACME issuance, scheduled renewals, and multi-cloud deployment from one unified control plane. A drag-and-drop workflow designer lets administrators construct visual pipelines linking domain validation, certificate issuance from Let's Encrypt or ZeroSSL, and automated distribution to edge destinations. Built-in automation interfaces connect with over seventy DNS providers to handle automated DNS-01 challenge record creation and cleanup without manual API scripting. Engineers can deploy renewed certificates directly to Nginx, Apache, Traefik, and Caddy instances via automated SSH commands or native webhooks. Cloud delivery workflows push updated certificates to AWS CloudFront, Cloudflare, Alibaba Cloud, Tencent Cloud, and Kubernetes Ingress secrets without service interruption. The web management console tracks expiration dates across multiple domains, highlights failing renewal attempts, and dispatches instant alerts through email, Telegram, DingTalk, and enterprise webhooks before outages occur. Running on a dedicated VPS on RepoCloud with guaranteed CPU, RAM, and SSD, full root SSH access, and a browser serial console. MIT licensed.
ToolHive
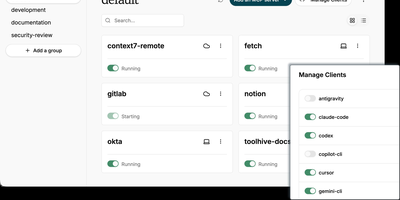
ToolHive is an open-source MCP server management platform that lets you run, secure, and orchestrate Model Context Protocol servers in isolated containers, giving AI agents structured access to tools like GitHub, databases, and cloud services without exposing host credentials or network. Every server launches inside its own sandboxed container with a minimal permission file, network access filtering, and encrypted secrets management, preventing misbehaving connectors from reaching beyond their defined scope. The built-in registry provides a catalog of vetted servers you can install with one command, while custom images and package-manager references let you onboard proprietary connectors without writing Dockerfiles. Platform teams deploy the Kubernetes operator to declare MCP servers as cluster resources using Custom Resource Definitions, with automated lifecycle management and multi-namespace isolation. The Virtual MCP Server gateway aggregates multiple backends behind a single endpoint, centralizing OIDC authentication, tool filtering, and composite cross-server workflows so clients connect once instead of juggling separate URLs. An MCP Optimizer analyzes tool schemas via semantic search and surfaces only relevant tools per request, cutting token consumption by up to 85%. OpenTelemetry traces and Prometheus metrics deliver full visibility into tool execution, latency, and request audit trails across every managed server. Running on a dedicated VPS on RepoCloud with guaranteed CPU, RAM, and SSD, full root SSH access, and a browser serial console. Apache 2.0 licensed.
Kopia
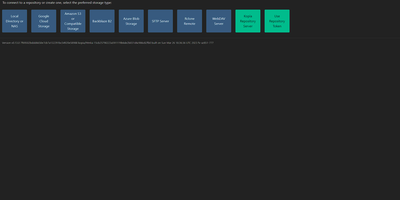
Engineers who have outgrown Duplicati or rsync scripts tend to appreciate Kopia's design: encrypted, compressed, content-deduplicated snapshots in Go, stored in a repository on any storage you control - S3, Google Cloud Storage, Azure Blob, Backblaze B2, SFTP, WebDAV, or a plain filesystem. Encryption is mandatory and end-to-end: every block is encrypted client-side with AES-256-GCM or ChaCha20-Poly1305 using keys derived from your repository password, and even file names never leave the machine in plaintext. Blocks are packed into 20-40 MB blobs with random names, so the storage provider learns nothing about content or structure. Deduplication is automatic and content-based - identical data across files, snapshots, and even multiple machines backing up to the same repository is stored once. Policies govern everything per-directory: compression choice, retention (hourly through annual), scheduling, and ignore rules. Incremental snapshots are point-in-time records you can mount and browse like a filesystem. This deployment runs the Kopia repository server with its web UI, centralizing backups from multiple client machines over an authenticated API - each client connects with the server URL and certificate fingerprint, and users only see their own snapshots. Error correction, high-latency-tolerant caching, and both CLI and GUI round it out.
GitLab
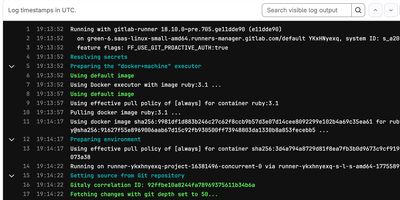
Used by over 100,000 organizations and ranked first in the Gartner Magic Quadrant for DevOps Platforms, GitLab is the open-core DevSecOps platform that delivers the complete software development lifecycle — from planning and source code management through CI/CD, security scanning, and monitoring — in a single self-managed application. The built-in CI/CD engine executes pipelines defined in YAML with parallel jobs, directed acyclic graph scheduling, multi-project pipelines, and auto-scaling runners on Docker, Kubernetes, or bare metal. Merge requests provide inline code review with approval rules, code owners, merge trains for serialized merging, and five merge strategies including fast-forward and semi-linear history. The integrated container registry stores Docker images alongside code, while the package registry supports npm, Maven, NuGet, PyPI, Conan, Go, and generic packages. Issue boards with epics, milestones, and labels enable agile planning, while the built-in wiki and GitLab Pages provide documentation hosting and static site publishing. Security scanning in the Community Edition includes basic SAST, secret detection, and container scanning running as pipeline jobs. The Omnibus installer bundles Rails, Puma, Gitaly, Workhorse, Nginx, PostgreSQL, Redis, Sidekiq, and Prometheus into a single package installable in minutes, while Docker and Helm chart options support containerized and Kubernetes deployments. GitLab Duo AI assists with code suggestions, merge request summaries, and vulnerability resolution. Running on a dedicated VPS on RepoCloud with guaranteed CPU, RAM, and SSD, full root SSH access, and a browser serial console. MIT licensed.
KubeSphere
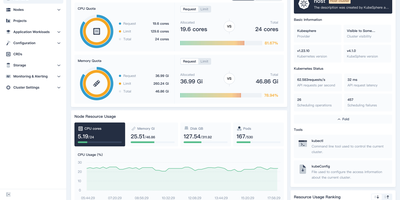
Managing Kubernetes shouldn't require every developer to become a Kubernetes expert — KubeSphere wraps cluster operations, CI/CD, service mesh, and observability into guided web workflows that operations teams configure once and developers consume without kubectl. The LuBan extensible architecture treats each capability as an independently installable extension plugging into a lightweight microkernel: enable DevOps without service mesh, add monitoring without the app store, compose exactly what your organization needs. Multi-cluster management provides a centralized control plane for provisioning and operating clusters across cloud providers, data centers, and edge locations with unified identity and resource quotas. The DevOps extension integrates Jenkins for graphical pipeline creation with S2I and B2I workflows, while Argo CD powers GitOps continuous deployment with real-time sync status. Istio-based service mesh provides traffic management, canary deployments, circuit breaking, and distributed tracing through the console without CLI knowledge. Prometheus monitoring with custom dashboards, Fluentd log collection with multi-tenant search, and alerting via Slack and email complete the observability stack. Multi-tenant workspace hierarchy enforces resource quotas and fine-grained RBAC roles across teams. A built-in Helm-based app store handles lifecycle management across clusters. KubeKey deploys production-grade clusters on bare metal or VMs with air-gapped support. Running on a dedicated VPS on RepoCloud with guaranteed CPU, RAM, and SSD, full root SSH access, and a browser serial console. Apache-2.0 licensed.
Zabbix
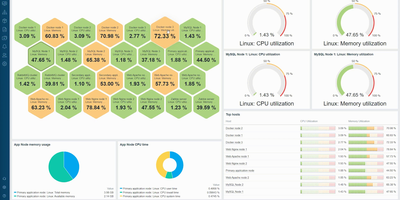
Monitoring everything from network switches to Kubernetes clusters since 2001 with over 6,200 GitHub stars and deployments exceeding 100,000 devices per installation, Zabbix has established itself as one of the most mature and feature-rich open-source monitoring platforms available, trusted by organizations including Dell, Salesforce, ICANN, and T-Mobile. The platform collects metrics from virtually any source using Zabbix Agent written in C, Zabbix Agent 2 written in Go with native plugin support, SNMP v1/v2c/v3 polling and trapping, IPMI for hardware health, JMX for Java applications, SSH and Telnet checks, HTTP/HTTPS polling, and ODBC database queries. Version 7.0 LTS introduced synthetic browser monitoring that executes user-defined JavaScript via WebDriver to simulate multi-step user interactions on websites, proxy load balancing with automatic host redistribution across proxy groups for high availability, in-memory proxy data buffering delivering up to 100x performance improvement, native multi-factor authentication with TOTP and Duo support, and just-in-time user provisioning from SAML and LDAP. Low-level discovery automatically detects file systems, network interfaces, SNMP OIDs, VMware resources, and Kubernetes pods, creating monitoring items and triggers dynamically. The alerting engine correlates events with configurable escalation chains, sending notifications through Slack, Microsoft Teams, PagerDuty, Jira, email, and SMS with customizable message templates. Over 1,000 official templates provide instant monitoring for Linux, Windows, VMware, AWS, Azure, Docker, PostgreSQL, MySQL, Apache, Nginx, and hundreds more. Running on a dedicated VPS on RepoCloud with guaranteed CPU, RAM, and SSD, full root SSH access, and a browser serial console. AGPL-3.0 licensed.
Kong
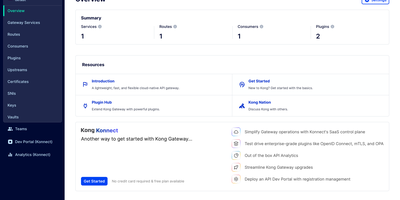
With over 43,000 GitHub stars and adoption by companies including Nasdaq, Samsung, and Expedia, Kong Gateway is the world's most deployed open-source API gateway, processing billions of API requests daily across hybrid-cloud and multi-cloud architectures. Built on the battle-tested NGINX engine with OpenResty's LuaJIT runtime, Kong delivers sub-millisecond proxy latency while supporting REST, gRPC, GraphQL, WebSocket, SOAP, and Kafka protocols. The plugin architecture includes authentication via JWT, Basic Auth, HMAC, key authentication, OAuth 2.0, and LDAP, alongside rate limiting with configurable windows per consumer, IP address, or API key. The AI Proxy plugin provides a universal LLM API that routes across OpenAI, Anthropic, Google Gemini, AWS Bedrock, Azure AI, Databricks, Mistral, and Hugging Face through a single standardized interface, while MCP proxy capabilities convert REST APIs into MCP tools and provide traffic governance for AI agents. Kong supports declarative configuration via YAML for GitOps workflows, a RESTful Admin API for dynamic configuration, and decK CLI for version-controlled infrastructure-as-code management. Upstream health checking with active and passive probes enables automatic failover, and the ring balancer distributes traffic across upstream targets with consistent hashing, round-robin, or least-connections algorithms. The Kong Plugin Hub hosts over 100 community and official plugins covering logging, monitoring, transformation, security, and traffic control. Running on a dedicated VPS on RepoCloud with guaranteed CPU, RAM, and SSD, full root SSH access, and a browser serial console. Apache 2.0 licensed.