Apache Superset
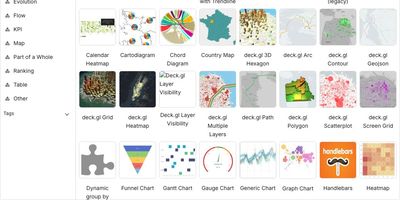
Powering data analytics at companies like Airbnb, Twitter, and Lyft where it originated, Apache Superset has become the leading open-source business intelligence platform with over 65,000 GitHub stars and an Apache Software Foundation top-level project designation. The platform ships with over forty visualization types out of the box including geographic maps, time-series charts, pivot tables, heatmaps, treemaps, and Sankey diagrams, all rendered with Apache ECharts for publication-quality output. Its SQL Lab provides a full-featured IDE experience with syntax highlighting, autocomplete, query history, and result caching for interactive data exploration. Superset connects natively to PostgreSQL, MySQL, ClickHouse, Trino, Presto, BigQuery, Snowflake, Apache Druid, Apache Hive, and dozens more databases through SQLAlchemy connectors, with support for custom database drivers via Python plugins. The semantic layer allows data teams to define calculated columns, metrics, and virtual datasets that business users can query without writing SQL. Role-based access control with row-level security enables fine-grained data governance, while the embedded analytics SDK lets you integrate dashboards directly into external applications via iframes with SSO pass-through. The caching layer supports Redis and Memcached for query result caching, and the asynchronous query execution engine powered by Celery handles long-running queries without blocking the UI. Alerts and reports can be scheduled via email or Slack with PNG or CSV attachments generated from any chart or dashboard. Running on a dedicated VPS on RepoCloud with guaranteed CPU, RAM, and SSD, full root SSH access, and a browser serial console. Apache 2.0 licensed.
Elmo
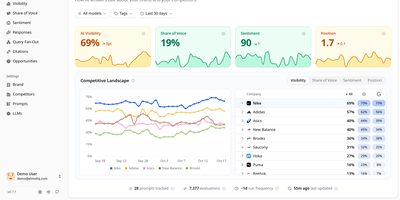
Tracking how ChatGPT, Claude, Gemini, Perplexity, and Google's AI answers talk about your brand, Elmo gives you a self-hosted dashboard for measuring and improving your AI search visibility. A setup wizard reads your website and suggests keywords, competitors, buyer personas, and tracking prompts. Behind the scenes, a worker reruns every tracked prompt on a schedule against the engines you connect, using scraping providers such as BrightData, Oxylabs, or SearchApi for real consumer experiences, or direct OpenAI, Anthropic, Mistral, and OpenRouter APIs. Each run feeds visibility scores per prompt and per model, mention tracking across names, aliases, and domains, sentiment from positive to negative, and each company's position in the answer. The Responses page filters answers by model, tag, prompt, or sentiment and highlights the passage behind each judgment. Citation analysis sorts cited URLs into your domains, competitors, social media, Google properties, and institutional sources. A share-of-voice leaderboard ranks competitors against you over time. Query fan-out shows the web searches engines ran before answering. Opportunities turns the numbers into a prioritized list of content to create, pitch, and seed. Shareable reports reach stakeholders without an account, and a REST API with TypeScript and Python SDKs plus an MCP server lets coding agents query the data. Raw engine output stays in your own database for later audit. Running on a dedicated VPS on RepoCloud with guaranteed CPU, RAM, and SSD, full root SSH access, and a browser serial console. MIT licensed.

Social Analyzer
Social Analyzer scans over 1,000 social media platforms in parallel to discover and correlate user profiles from a single username query, making it the most comprehensive OSINT reconnaissance tool of its kind. Three detection modes cover different accuracy and speed tradeoffs: fast HTTP library checks for rapid sweeps, Selenium WebDriver validation for JavaScript-heavy sites, and a special mode for stubborn edge cases. String analysis generates username permutations and combinations to catch related accounts with slight naming variations. Three interfaces serve different workflows: a Node.js web application on port 9005 with a browser-based GUI, a CLI for scripted batch operations, and Python plus Node.js APIs for embedding into automated investigation pipelines. The QeeqBox OSINT library extracts profile metadata, screenshots, titles, descriptions, and activity patterns, all visualized through Ixora-based force-directed graphs that map relationships between discovered accounts. Tesseract OCR analyzes profile images for additional detection vectors. Search results narrow by country codes, website categories, Alexa ranking thresholds, and confidence levels. Optional Google API and DuckDuckGo API integration adds search engine correlation alongside direct platform queries. Docker deployment bundles Node.js, Firefox ESR, Tesseract, and all dependencies into one container. Trusted by law enforcement and security researchers for digital forensics and identity verification. 23,000+ GitHub stars. AGPL-3.0 licensed.
ghstats
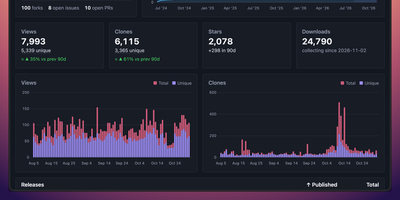
GitHub forgets your traffic after fourteen days; ghstats remembers it for years. This self-hosted dashboard polls the GitHub API every hour and keeps views, clones, stars, forks, issues, and pull requests for every repository in its own database, long after the built-in traffic tab has rolled over. Open a repository to see its charts for stars, clones, and views next to top referrers and popular paths, filter the list by owner, name, forks, or archived status, and include private repositories when your token allows it. Public stats pages and portfolios reuse the same numbers through a JSON API, embeddable SVG badges for views, clones, and star velocity, and cards ranking your top repositories or showing star history across projects. Release download counts accumulate as daily snapshots too, so a launch spike stays visible months later. The whole service is one small Docker image on port 8080 with a single file for storage, easy to back up and easy to move. Running on a dedicated VPS on RepoCloud with guaranteed CPU, RAM, and SSD, full root SSH access, and a browser serial console. MIT licensed.
Mixpost
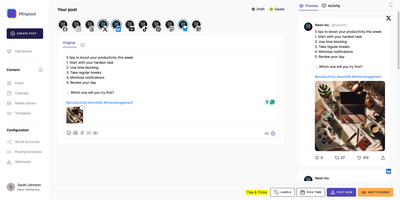
Mixpost puts Facebook, Instagram, X, LinkedIn, YouTube, TikTok, Pinterest, Threads, Bluesky, Mastodon, Pixelfed, and Google Business under a single scheduling dashboard — plan content visually on a drag-and-drop calendar, queue posts for optimal engagement windows, and track audience growth per platform without juggling twelve separate apps or paying per-seat SaaS fees. Built on Laravel with a Vue.js 3 and Inertia.js frontend styled with Tailwind CSS, the Lite edition provides unified content management where each post supports platform-specific customization with individual captions, media attachments, hashtag groups, and first-comment scheduling. Posting queues automate publishing at configurable time slots throughout the day. The media library provides a centralized asset manager with drag-and-drop uploads, stock photo integration via Unsplash, and Tenor GIF search. AI-powered content assistance generates and optimizes post copy. Per-platform analytics dashboards display audience growth, engagement metrics, reach, and impressions with exportable reports. Team workspaces support role-based permissions for collaborative content management across departments. External integrations connect through the REST API, webhooks, n8n, Zapier, and RSS feeds, plus an MCP server for AI assistant publishing. Deploy via Docker Compose with MySQL and Redis. Running on a dedicated VPS on RepoCloud with guaranteed CPU, RAM, and SSD, full root SSH access, and a browser serial console. MIT licensed.
Formbricks
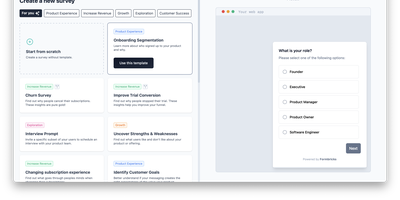
In-app, website, link, and email surveys feed one open-source experience management platform: Formbricks. Its distinguishing strength is targeted in-app research: a JavaScript SDK triggers surveys on user events and attributes, with segmentation rules like "power users who have not seen a survey in 10 days," so questions reach the right cohort at the right moment instead of a mass email blast. The no-code editor offers 20+ question types including NPS, CSAT, CES, matrix, ranking, and file upload, with skip logic, conditional branching, best-practice templates, and full brand theming. Responses feed built-in analytics with summaries and CSV/JSON export, and integrations push data to Slack, Notion, Google Sheets, Airtable, Zapier, and n8n, with webhooks and an open API on every tier. Because self-hosted surveys load from your own domain rather than a blacklisted third-party script host, ad blockers do not suppress them - in-app surveys reach users that Hotjar-style tools silently miss, which measurably raises response rates. Self-hosting also removes the third-party sub-processor from your privacy policy entirely: survey responses often contain PII, and keeping them on your own server matters for GDPR-sensitive and regulated industries. The Community Edition has no response caps or tier-gated features, so core functionality and your data stay accessible regardless of any subscription. Next.js on PostgreSQL, AGPLv3.
Liwan
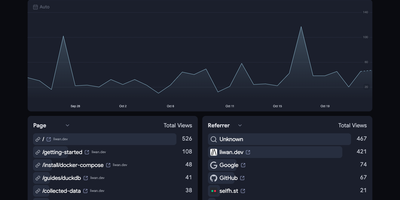
When you want honest traffic numbers without tracking cookies or stored IP addresses, Liwan puts a real-time analytics dashboard on your own server. The dashboard ranks pages, referrers, countries, browsers, platforms, and devices, charts visitors over time, and filters out bot traffic by default. Session metrics add bounce rate, average time on site, and entry and exit pages, while UTM fields attribute visits to campaigns. Collection is adjustable globally and per site: choose how visitors are grouped, whether to store country and city, country only, or no location, and how long events are kept. Drop rules discard internal, test, and local traffic before storage, and a pruning tool applies new settings to history after a dry-run preview. Tracking is one line of HTML, or your own server can send events with custom names and properties. Location can come from a MaxMind database or from Cloudflare, Vercel, and other proxy headers. One instance holds several projects and sites, with team accounts and single sign-on through Google Workspace, Microsoft Entra ID, or an OpenID Connect provider such as Keycloak or Dex. Running on a dedicated VPS on RepoCloud with guaranteed CPU, RAM, and SSD, full root SSH access, and a browser serial console. Apache-2.0 licensed.

Cited
Buyers now ask an AI assistant before they ever visit your website, and Cited tells you whether your brand made it into the answer. Verify your domain with a DNS record, choose the buyer-like prompts worth watching, and Cited checks them on schedule across ChatGPT, Claude, Gemini, Perplexity, Google AI Mode, and Google AI Overviews. Every meaningful appearance becomes a durable evidence note in your citation inbox: open one to see the exact prompt, the response snapshot, where your domain appeared, and the first-seen history. It distinguishes a true source citation from a brand mention without a link, an explicit recommendation, and the uncomfortable one, a missed opportunity where a competitor got cited and you did not. Competitor tracking runs continuously, so you see rivals earning answers in your category while there is still time to respond. Notes can be annotated, organized through new, seen, saved, and resolved states, and exported for reporting. Email alerts flag meaningful new events and a weekly digest summarizes what changed, so checking becomes a habit instead of another dashboard to babysit. Workspace roles and local credentials keep a small marketing team organized on your own PostgreSQL database. Running on a dedicated VPS on RepoCloud with guaranteed CPU, RAM, and SSD, full root SSH access, and a browser serial console. AGPL-3.0 licensed.
Talivia
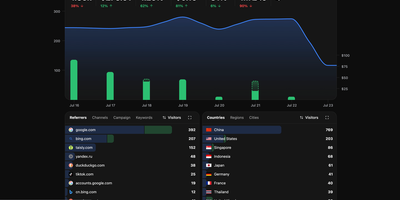
Founders do not need another chart of pageviews; they need to know which visit became money, and Talivia is a self-hosted, revenue-first analytics platform that fuses website traffic with payment data so every metric answers in dollars. Connect Stripe, LemonSqueezy, Polar, Dodo, or Yolfi, and the dashboard pairs visitor counts with revenue, conversion rate, revenue per visitor, refunds, and disputes, so a traffic spike that never buys anything stops masquerading as success. Referrers, campaigns, keywords, and countries are ranked by the money they produce, which reduces budget decisions to one question: which channel brought customers who actually paid? When a page underperforms, session replay shows what visitors actually did there and the moment they gave up, so you debug journeys instead of guessing from aggregates. Events and multi-step funnels trace the path from landing page to checkout, while bot traffic detection stops crawlers from inflating your conversion statistics. The live visitor feed shows who is browsing right now, with country, device, browser, acquisition source, events, and spend for each session as it unfolds. Public links publish any dashboard as a read-only page for investors or clients, and teammates join the workspace with their own accounts when they need to dig deeper. Visitors, replays, and payment records all stay in your own PostgreSQL database, so customer journeys never pass through a third-party analytics cloud. Running on a dedicated VPS on RepoCloud with guaranteed CPU, RAM, and SSD, full root SSH access, and a browser serial console. MIT licensed.
Agentic Resource Registry
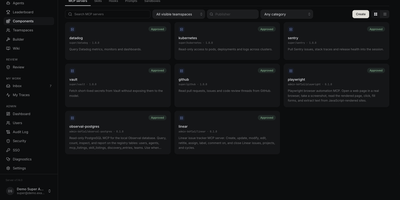
Every team building with coding agents has the same drawer problem: the best Skill, MCP server, or agent file lives in one person's repo, undocumented, while three colleagues rebuild it from scratch. Agentic Resource Registry is the internal catalog that ends the duplication, a self-hosted registry where your organization publishes Skills, MCP servers, hooks, prompts, agent files, and sandboxes in one searchable place. Browse by teamspace, publisher, category, or harness and see at a glance what each resource supports and how often it has been pulled. Authors build agent files in a four-step builder with a live summary and draft readiness checks, then submit them into a review queue where admins inspect the full prompt and version diffs before approving. Forking an approved release creates your own draft with pinned components, and reviewers can compare it against upstream line by line. The companion CLI installs any approved resource into Claude Code, Cursor, Codex, Kiro, Copilot, OpenCode, Pi, and more, generating the correct config for each harness automatically. Approved resources are also discoverable over the open ARD standard, so a running agent can hand part of its task to another approved agent or a remote A2A service. Running on a dedicated VPS on RepoCloud with guaranteed CPU, RAM, and SSD, full root SSH access, and a browser serial console. Apache-2.0 licensed.
Trade Journal
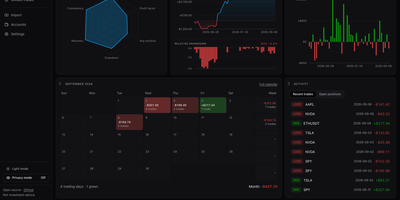
A trading journal you host yourself, Trade Journal rebuilds broker fills and statement exports into round-trip trades, a profit and loss calendar, and daily notes that show what actually works. Read-only sync covers more than twenty brokers and exchanges, including Alpaca, Binance, Coinbase, Kraken, and IBKR Flex. Statement import auto-detects TradingView, MetaTrader, NinjaTrader, Tradovate, and thinkorswim files, handles TradeZella and Tradervue CSV migrations, and maps columns for anything else. Trades can be matched first-in-first-out, last-in-first-out, or by weighted average, with partial fills, scale-ins, and futures multipliers handled. The dashboard offers gauges, cumulative and daily P&L, an Edge Score radar, and cards you can rearrange into named layouts, while Reports break results down by symbol, tag, mistake, playbook, weekday, and time of day. Each trade page charts entries and exits and can replay candles you load, with estimated MAE and MFE. Daily journal pages hold Markdown notes, templates, attachments, and voice dictation, and optional AI recaps use your own Anthropic or OpenAI key or a local Ollama model. Playbook checklists score rule adherence, a prop firm ledger tracks costs and payouts, and privacy mode masks every amount. Running on a dedicated VPS on RepoCloud with guaranteed CPU, RAM, and SSD, full root SSH access, and a browser serial console. MIT licensed.
Betterlytics
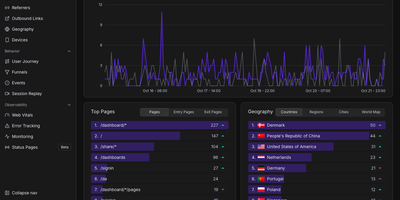
Page views, funnels, session replays, error reports, Core Web Vitals, and uptime checks share one cookieless dashboard in Betterlytics, so teams stop stitching several tools together. The overview charts visitors, page views, bounce rate, and visit duration against the previous period, and annotations mark launches or campaigns right on the timeline. Breakdowns cover referrers, channels, UTM campaigns, browsers, devices, and operating systems, with visitor locations on a world map once an optional MaxMind key is added. Custom events, global properties such as plan or app version, and outbound link tracking show what visitors actually do, while user journey diagrams and funnels reveal where they drift away. Session replay is opt-in per tracking script, masks text and form inputs by default, and can keep recordings in your own S3-compatible bucket. Error tracking groups JavaScript errors with stack traces, a session trail, and a link to the matching replay. Uptime and SSL monitors alert through Slack, Discord, Teams, or webhooks and feed public status pages on your own domain. Teammates join by invitation, two-factor login is available, and a built-in MCP server lets Claude, Cursor, or Codex answer traffic questions. A script of about 3.5 KB or a WordPress plugin handles installation. Running on a dedicated VPS on RepoCloud with guaranteed CPU, RAM, and SSD, full root SSH access, and a browser serial console. AGPL-3.0 licensed.
Swetrix
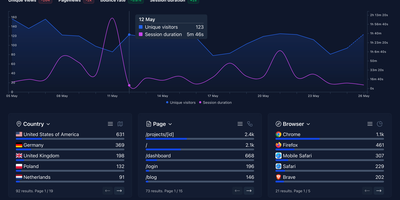
Traffic analytics, real-user performance monitoring, and client-side error tracking - normally three tools - in one cookieless, privacy-first dashboard: Swetrix. The Community Edition ships the same core engine as the cloud product - a NestJS API with ClickHouse for high-volume event storage, MySQL for relational data, and Redis for caching, fronted by a React dashboard and a ~5 KB tracking script with official packages for 20+ frameworks including Next.js, WordPress, and Shopify. Traffic analytics cover pageviews, referrers, UTM campaigns, geolocation, sessions with page flows, funnels, and custom events - all anonymized server-side with no cookies, no cross-device tracking, and no consent banner required for GDPR compliance. Performance monitoring records real-user metrics per pageview: TTFB, DNS and TLS timing, and render times, so regressions surface in the same place as traffic. Error tracking captures unhandled JavaScript exceptions automatically with formatted stack traces, filename/line metadata, affected browsers and pages, first/last-seen timestamps, and a resolve workflow - replacing a separate error monitoring subscription for many teams. Alerts fire to email, Slack, Telegram, Discord, or webhooks on traffic spikes, new errors, and custom events. If Plausible covers your traffic questions but you also want to know why the site broke, Swetrix answers both.
Talo
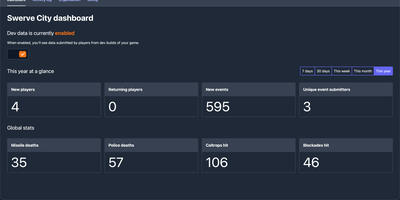
Shipping a game is hard enough without also building account systems, and Talo is the self-hosted backend that gives your Godot or Unity title player authentication, leaderboards, cloud saves, and analytics on infrastructure you control. Players persist across sessions with segments you define, so you can group testers, whales, or speedrunners and treat each group differently. Leaderboards sort ascending or descending, refresh on daily or weekly schedules, hide suspicious entries from the dashboard, and sync with Steamworks in one click. Event tracking records individual and global player actions, and the dashboard turns that stream into charts you can filter by group when a balance patch lands badly. Game saves load and store flexible state that also works offline, while global and per-player stats track everything from completions to currency earned. Live config lets you tune game settings from the web and push changes to running games with zero downtime. Channels carry real-time messages between subscribed players, presence shows who is online with custom statuses, and relationships add friends and followers when your game grows social. Steamworks, Google Play Games, and Apple Game Center integrations verify ownership and authenticate players through the platforms they already use. Running on a dedicated VPS on RepoCloud with guaranteed CPU, RAM, and SSD, full root SSH access, and a browser serial console. MIT licensed.
OpenOps
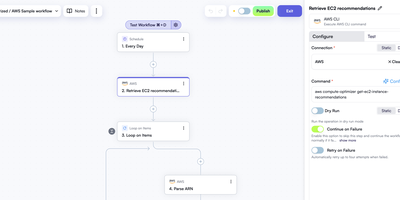
Cloud cost dashboards show what is being wasted; OpenOps is the no-code FinOps platform that acts on it, finding idle resources, asking the right owner for approval, and cleaning up once someone clicks yes. A visual editor starts each workflow from a schedule, cron expression, webhook, new Jira or Linear issue, or incoming email, and chains 120+ actions covering AWS, Azure, and Google Cloud operations, loops, conditions, delays, and code steps. Approval requests arrive as buttons in Slack or Microsoft Teams, or as approve and reject links by email, and the workflow waits for the answer before branching. Connectors for CloudHealth, Cloudability, Vantage, Finout, Flexera, and Umbrella feed in recommendations and anomalies. The template catalog ships with workflows for idle resource cleanup and rightsizing across AWS, Azure, and Google Cloud, and a free OpenOps Cloud account extends it. Findings land in built-in Tables where they can be approved, dismissed, marked as false positives, or snoozed. Analytics turns those tables, CSV files, Google Sheets, or Postgres data into dashboards. Test any step against live systems or sample data, inspect every run, and track changes in version history. Bring your own LLM key to generate CLI commands, SQL queries, and code right in the editor. Running on a dedicated VPS on RepoCloud with guaranteed CPU, RAM, and SSD, full root SSH access, and a browser serial console. Apache-2.0 licensed.
Apache Zeppelin
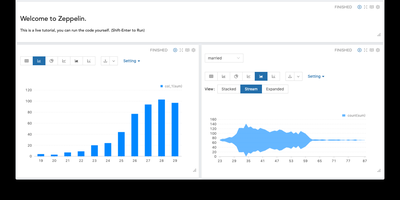
Analysts explore data where it lives with Apache Zeppelin, a web notebook where each paragraph can speak a different language: run Spark in Scala, query through SQL, prototype in Python, and plot the results without leaving the page. Pluggable interpreters connect notebooks to Spark, Flink, JDBC databases, Neo4j, Elasticsearch, and dozens of other engines, all sharing variables through the ZeppelinContext so a DataFrame built in one paragraph feeds the next in another language. Built-in visualizations turn query output into bar, pie, line, and scatter charts with pivot controls, while dynamic forms add dropdowns and inputs that make notebooks reusable reports for colleagues. Multiple Spark and Scala versions coexist in one instance, with interpreter binding modes from globally shared to isolated per note, and execution on local, standalone, YARN, or Kubernetes clusters. Teams collaborate through multi-user support with authentication and note permissions, schedule notebooks as jobs, and drive everything through a REST API. The 0.12.1 maintenance release hardens JWT validation and path traversal defenses, upgrades the Angular frontend, and stabilizes the Spark, Flink, Python, Neo4j, and File interpreters. Running on a dedicated VPS on RepoCloud with guaranteed CPU, RAM, and SSD, full root SSH access, and a browser serial console. Apache-2.0 licensed.
Rybbit
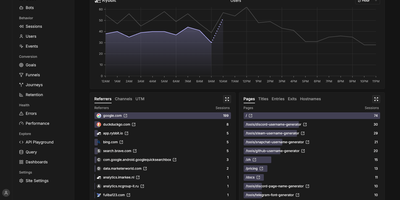
Google Analytics without the cookie banner or the maze of menus: Rybbit puts web and product analytics for every site you run on one readable dashboard, hosted on your own server. Pageviews, sessions, unique users, bounce rate, session duration, traffic sources, campaigns, devices, and countries update in real time beside a live visitor count. Session replay lets you watch the visits behind the numbers, and user profiles tie identified visitors to their sessions and events. Funnels pinpoint where conversions leak, journeys chart the paths people take through a site, retention reports show who comes back, and goals track conversions from page visits, custom events, and autocaptured clicks. Custom events carry JSON properties, filters slice every report across more than 15 dimensions, saved segments reapply them in one click, and location tracking drills from country to region to city on interactive maps, with optional 3D globe views through a Mapbox token. Error tracking connects JavaScript failures to the affected sessions, so a spike in errors leads straight to the visits that explain it. One install serves unlimited sites and organizations with role-based access, public dashboards share a site's stats through a link, and a tracking script of about 11 KB compressed collects data with no cookies and no consent banner. Running on a dedicated VPS on RepoCloud with guaranteed CPU, RAM, and SSD, full root SSH access, and a browser serial console. AGPL-3.0 licensed.
Apache Doris
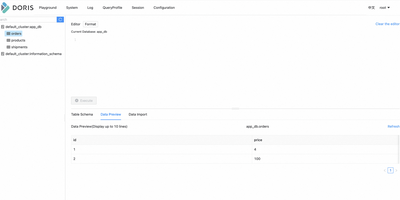
Dashboards should not wait minutes for yesterday's data, so Apache Doris answers analytical SQL over fresh data with a massively parallel, fully vectorized engine that processes column batches instead of row after row. Frontends receive queries over the MySQL protocol, plan them with a cost-based optimizer, and coordinate execution, while Backends store columnar tablets and run scans, joins, and aggregations in parallel pipelines across cores. Data lands continuously through stream and batch loads, broker imports from object storage, and change capture from operational databases, and it is queryable immediately for reporting that reflects the last minutes rather than the last nightly job. Tables outside Doris join the same SQL through catalogs for Hive, Iceberg, Paimon, Hudi, and JDBC sources, with local caching and materialized views accelerating the lakehouse queries your team runs every day. Search workloads live here too: an inverted index and a SEARCH function provide full-text retrieval, vector indexes support similarity search, and AI functions call language models from SQL for extraction and summarization, so hybrid queries mix keywords, semantics, and structured filters in one statement. Workload groups, resource controls, and compute-storage separation in cloud mode keep interactive dashboards fast while heavy ETL spills safely to disk. Running on a dedicated VPS on RepoCloud with guaranteed CPU, RAM, and SSD, full root SSH access, and a browser serial console. Apache-2.0 licensed.