OpsiMate
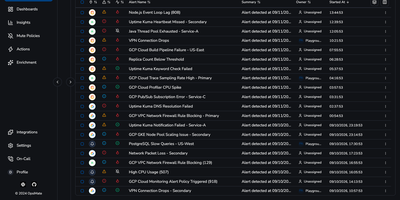
OpsiMate gives on-call teams one queue for alerts that would otherwise arrive in five different dashboards, each demanding attention in its own tab. Connect Grafana, Datadog, Zabbix, Uptime Kuma, Google Cloud, or any custom webhook source and watch incoming alerts land in one table with their source, service, severity, tags, and status attached. Filter the noise down to the team or service you own, group related alerts so one incident does not look like forty separate emergencies, and use mute policies when a known problem should stop paging people. Acknowledge work with one click, assign ownership so nobody wonders who is responding, resolve alerts from the same screen, and follow deep links back into Grafana or Zabbix when you need the original chart or trigger. Let supported integrations auto-resolve alerts when the underlying monitor recovers, and use root-cause notes and insights to keep the next responder from starting at zero. Discover services running in Docker, Kubernetes, and Linux virtual machines so the alert queue stays connected to the infrastructure behind it. Running on a dedicated VPS on RepoCloud with guaranteed CPU, RAM, and SSD, full root SSH access, and a browser serial console. AGPL-3.0 licensed.
Grafana OnCall
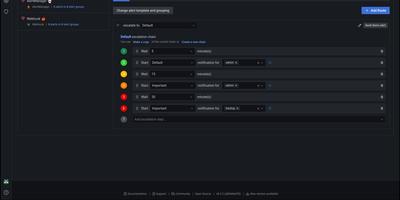
With 3,900 GitHub stars, 140 contributors, and 380 releases since its 2022 launch, Grafana OnCall delivers developer-friendly incident response that routes alerts from any monitoring system to the right engineer at the right time through the right channel. The platform accepts alerts via unique API URLs from Alertmanager, Grafana Alerting, Zabbix, Datadog, Pagerduty-compatible sources, Jira, inbound email, and generic HTTP webhooks, then applies routing templates to direct each alert to the appropriate escalation chain. Escalation chains define notification sequences — notify the primary on-call via Slack, wait 5 minutes, escalate to SMS and phone, wait 10 minutes, page the secondary on-call and notify the engineering manager — continuing until acknowledgment or resolution. On-call schedules support multi-layer rotations with overrides, shift swaps, and timezone-aware handoffs rendered directly inside Grafana dashboards. ChatOps integration publishes alert groups to Slack channels and Telegram groups with interactive buttons for acknowledge, resolve, and silence actions. Template engines based on Jinja2 control alert grouping, appearance rendering, and behavioral automation. The REST API enables programmatic management of integrations, schedules, and escalation policies. Deploy via Docker Compose with PostgreSQL, Redis, and Celery workers alongside your existing Grafana instance. Running on a dedicated VPS on RepoCloud with guaranteed CPU, RAM, and SSD, full root SSH access, and a browser serial console. GNU AGPL v3 licensed.