Stars
Forks
Watchers
Developer links
OpsiMate
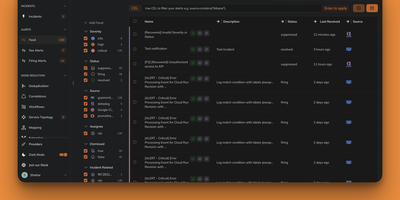
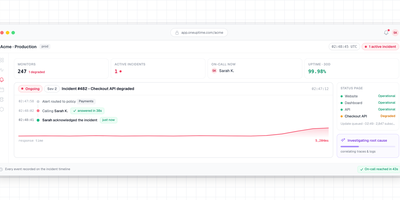
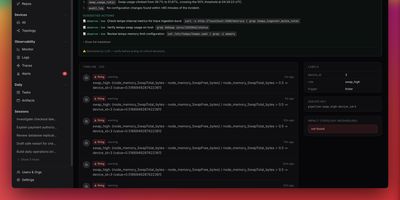
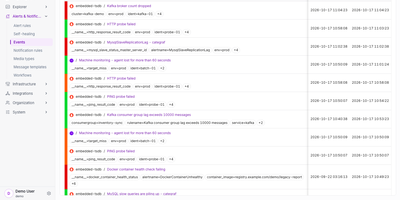
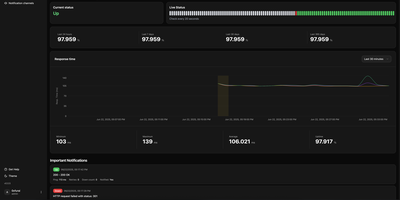
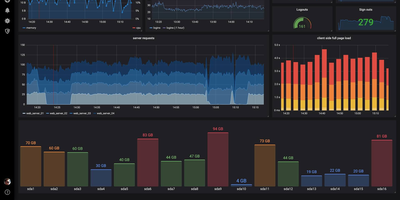
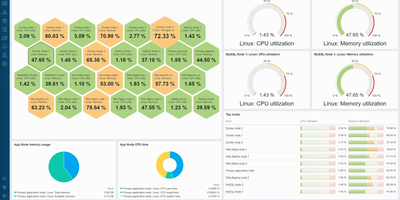
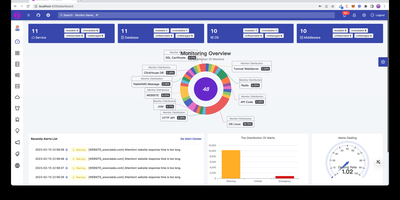
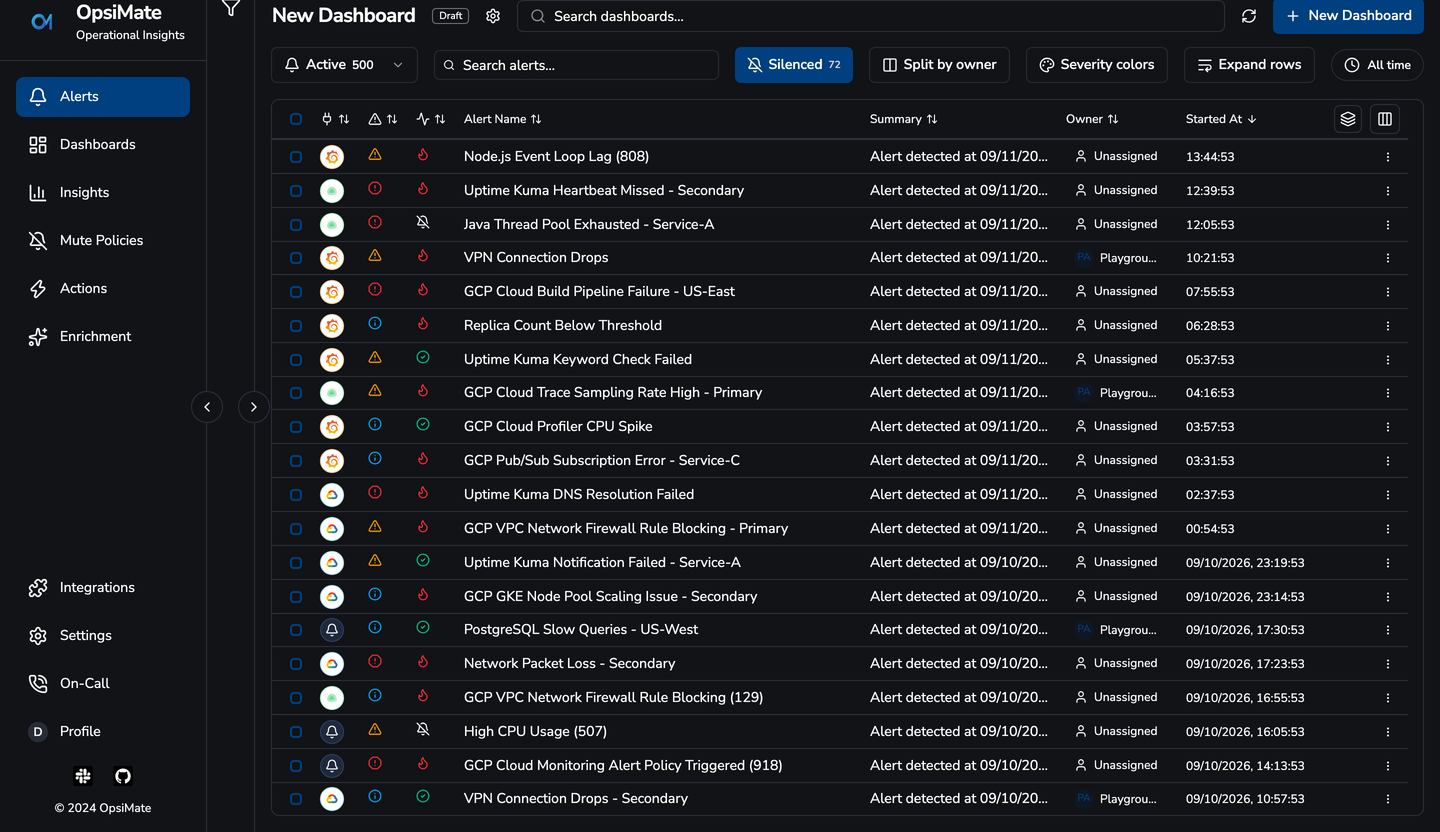
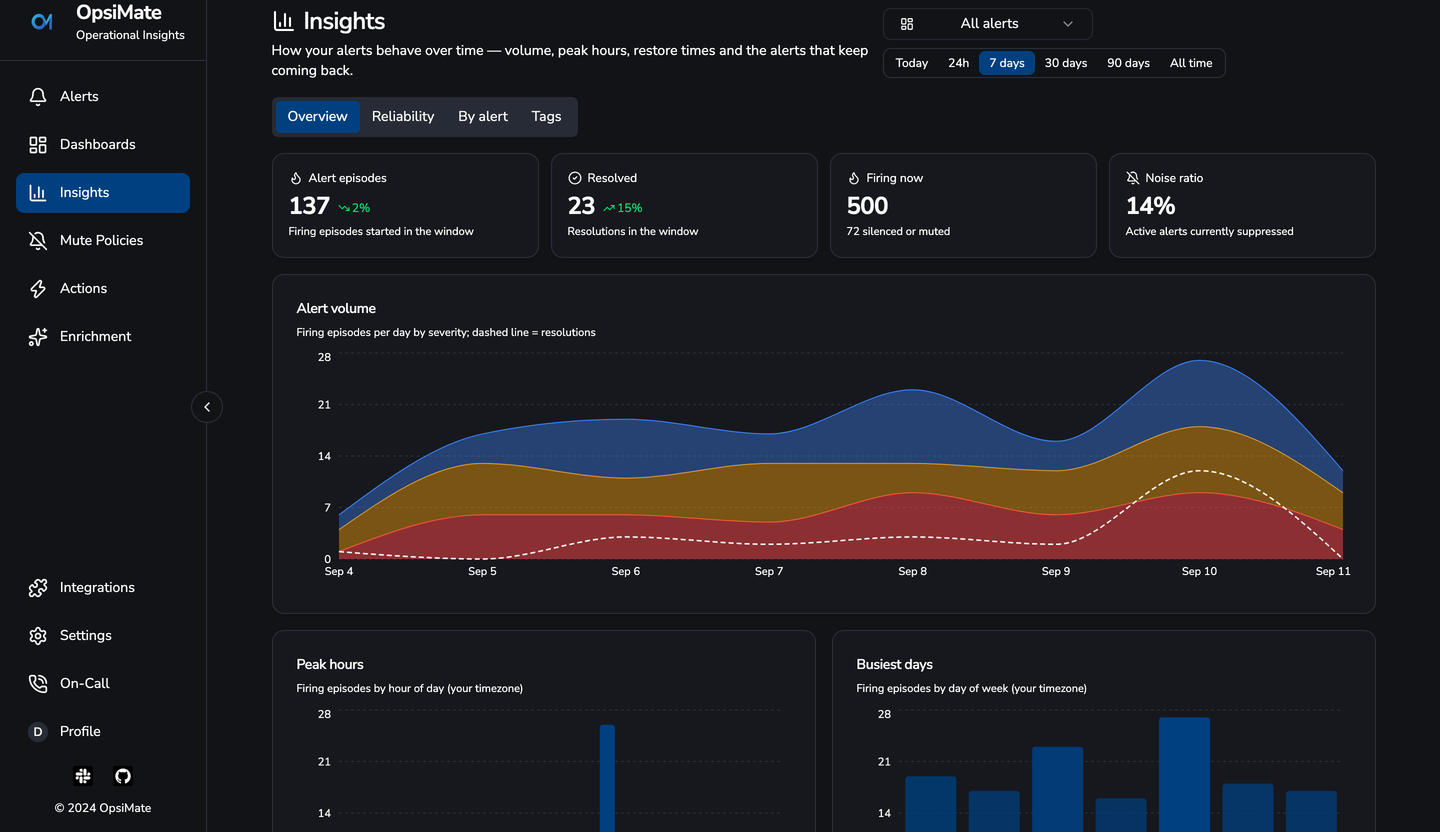
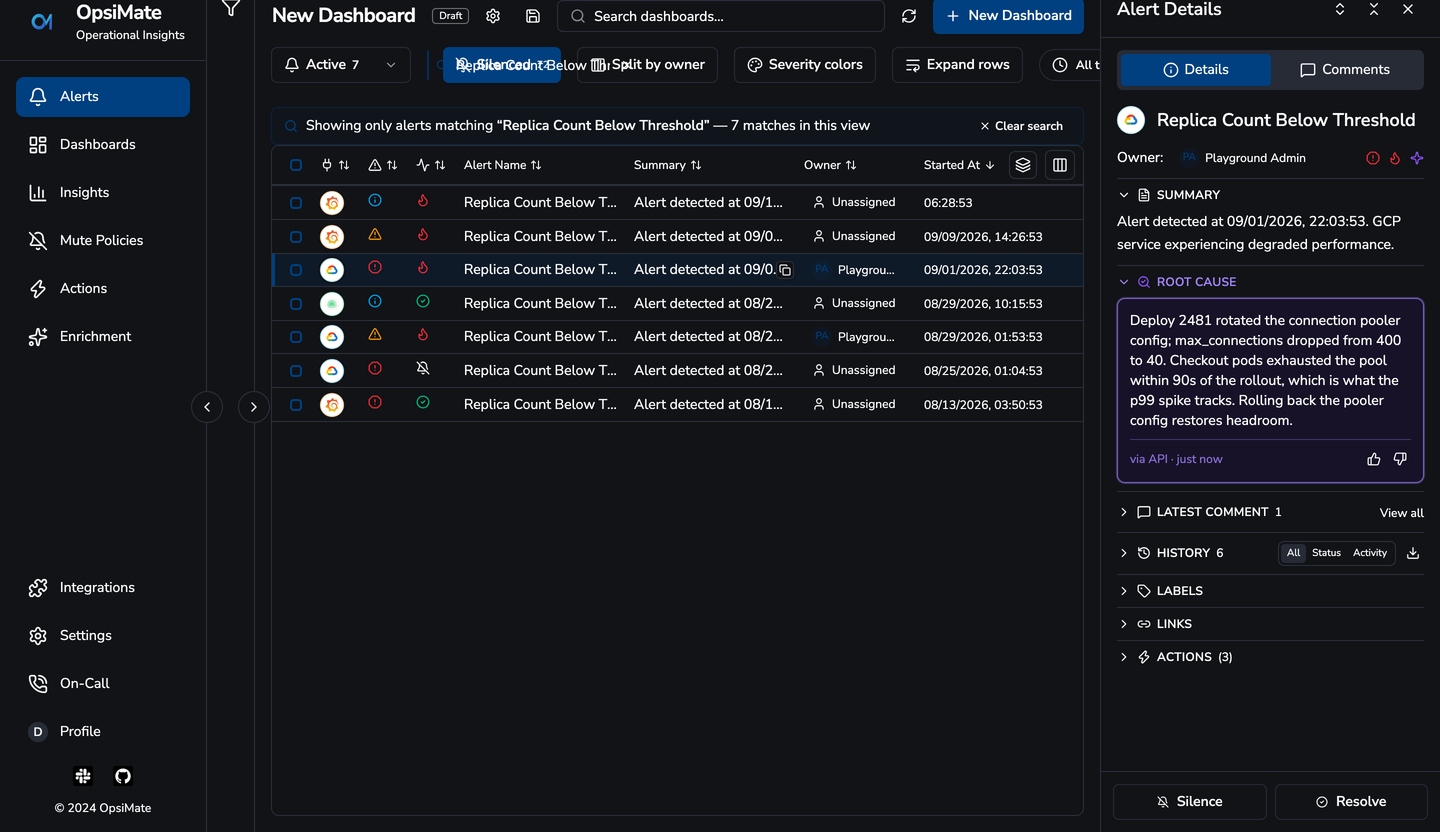
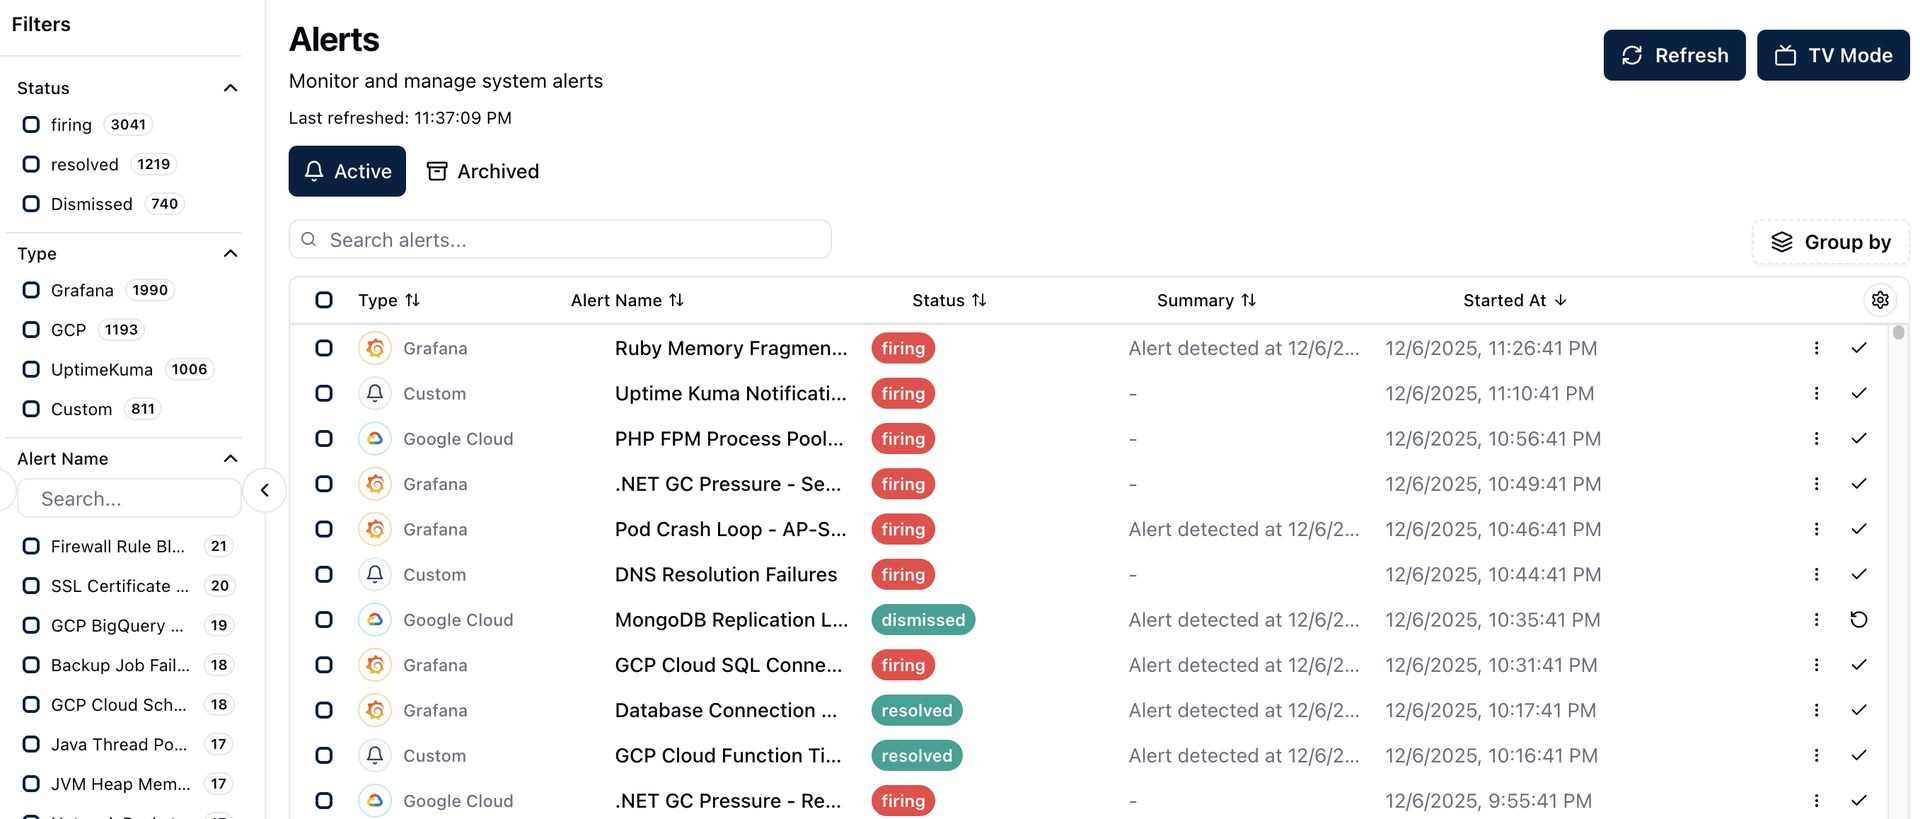
OpsiMate gives on-call teams one queue for alerts that would otherwise arrive in five different dashboards, each demanding attention in its own tab. Connect Grafana, Datadog, Zabbix, Uptime Kuma, Google Cloud, or any custom webhook source and watch incoming alerts land in one table with their source, service, severity, tags, and status attached. Filter the noise down to the team or service you own, group related alerts so one incident does not look like forty separate emergencies, and use mute policies when a known problem should stop paging people. Acknowledge work with one click, assign ownership so nobody wonders who is responding, resolve alerts from the same screen, and follow deep links back into Grafana or Zabbix when you need the original chart or trigger. Let supported integrations auto-resolve alerts when the underlying monitor recovers, and use root-cause notes and insights to keep the next responder from starting at zero. Discover services running in Docker, Kubernetes, and Linux virtual machines so the alert queue stays connected to the infrastructure behind it. Running on a dedicated VPS on RepoCloud with guaranteed CPU, RAM, and SSD, full root SSH access, and a browser serial console. AGPL-3.0 licensed.
Benefits
- One Queue For Every Alert
- Aggregate Grafana, Datadog, Zabbix, Uptime Kuma, Google Cloud, and custom webhook alerts in a single workspace instead of asking responders to patrol five to ten separate monitoring dashboards.
- Less Fatigue, Clearer Ownership
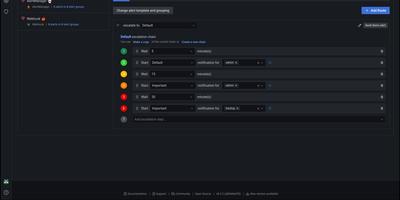
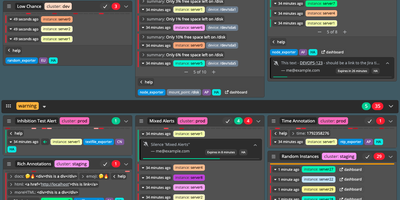
- Group related alerts, filter by service, team, severity, tags, or status, apply mute policies, and assign ownership so noisy incidents become one accountable work item rather than repeated pages.
- Faster Triage With Context
- Acknowledge and resolve from the alert table, follow deep links back to the source monitor, and benefit from automatic resolution when Grafana or Zabbix reports that the problem recovered.
- Self-Hosted Incident Data
- Keep alerts, users, integrations, and private keys in persistent local volumes on your server, with the web UI on port 8080 and API health checks available on port 3001.
Features
- Webhook Alert Integrations
- Receive pushed alerts from Grafana, Datadog, Zabbix, Uptime Kuma, Google Cloud Monitoring, and custom webhook senders, with source icons preserved in the unified alerts table.
- Filtering And Grouping
- Organize alerts by type, status, service, team, severity, and flexible tags, then use saved criteria and grouping to separate urgent incidents from background monitoring noise.
- Quick Response Actions
- Acknowledge, assign, mute, and resolve alerts with one click, while supported integrations add automatic resolution and deep links back to the originating monitoring system.
- Service Discovery
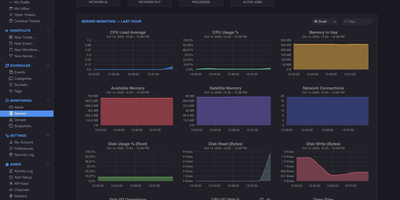
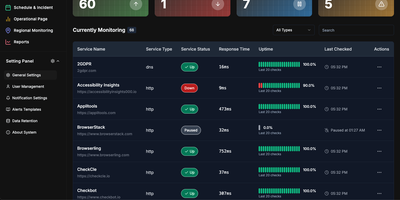
- Discover and monitor services across Docker containers, Kubernetes workloads, and Linux virtual machines using systemd, connecting alert context to the systems that generated it.
- Docker Compose Deployment
- Run frontend, backend API, and worker containers together with persistent SQLite data and private-key volumes, then register the first user as administrator from the browser.