Dekart
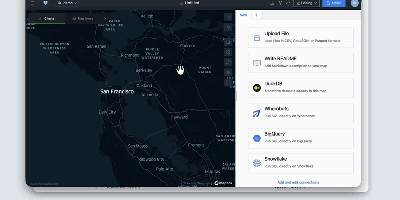
Dekart turns SQL queries against your data warehouse into interactive maps and charts you can share with a link. Connect Postgres, BigQuery, Snowflake, Wherobots, or DuckDB, write a query, and the results render as WebGL map layers that stay responsive even at a million points. Layers stack: put places in one, boundaries in another, add H3 hexagon aggregations where raw points would turn into soup, and tune colors and styles until the pattern you suspected in the table becomes obvious on the map. Interactive charts sit beside the map and move with it, so filtering a distance histogram or a category breakdown updates the geography at the same time. Query parameters let viewers change inputs like radius or date range without touching SQL, which makes one report serve a whole team. Maps share through private links, so a stakeholder opens the live result instead of receiving a stale screenshot in a slide deck. Uploading a CSV, GeoJSON, or Parquet file is enough for a quick one-off, and Markdown reports add explanation next to the data. AI agents can join in through the MCP interface to build and refine maps from natural-language requests. Single sign-on through Google OAuth, Keycloak, Cognito, or IAP keeps access governed, and the whole application runs as one Docker container with built-in storage for zero-configuration starts. Running on a dedicated VPS on RepoCloud with guaranteed CPU, RAM, and SSD, full root SSH access, and a browser serial console. AGPL-3.0 licensed.
Deploy