Aeterna
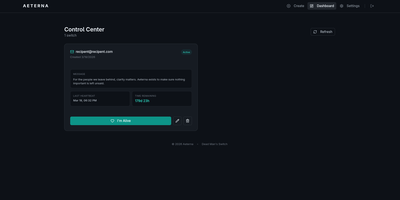
Some messages should only arrive if you cannot send them yourself, and Aeterna is a self-hosted dead man's switch that makes sure they do. You write the messages, attach the files that matter, name the people who should receive them, and check in on a rhythm you choose. Keep checking in and nothing happens. Stop, and Aeterna delivers what you left behind. Each switch pairs your words with documents, photos, or instructions for specific recipients, and switches can address multiple recipients so one message can reach a partner, a sibling, and a lawyer at the same time. File attachments are stored encrypted and are automatically deleted from the server right after delivery, so sensitive material does not linger once it has done its job. Check-ins take seconds through the web interface or a quick link in your email, which keeps the heartbeat habit painless. When a switch fires it can also call webhooks, triggering home automation or custom scripts alongside the emails. Your SMTP settings live in the settings screen with live testing, and reverse proxy templates for Nginx, Traefik, and Caddy help you put the service behind your own domain with proper certificates. Running on a dedicated VPS on RepoCloud with guaranteed CPU, RAM, and SSD, full root SSH access, and a browser serial console. GPL-3.0 licensed.
Healthchecks
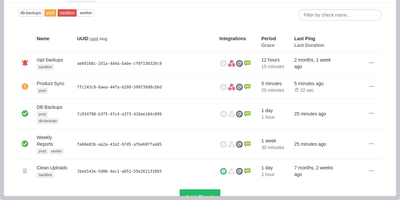
With 10,100+ GitHub stars and 75 releases over a decade of continuous development, Healthchecks is the open-source cron job monitoring service that catches failures your other monitoring tools miss — the jobs that silently stop running, the backups that never completed, the nightly reports that disappeared without error. The dead man's switch architecture requires zero agent installation: your cron jobs, scripts, and services ping a unique URL via HTTP request or email, and Healthchecks alerts you only when a ping does not arrive within the configured Period and Grace Time window. Each check supports cron expression scheduling, optional start, success, and failure signals for measuring execution time, and HTTP body keyword filtering for intelligent alert routing. Twenty-five notification integrations cover every channel teams actually use: Slack, Discord, Microsoft Teams, PagerDuty, Opsgenie, Splunk On-Call, Telegram, Signal, WhatsApp, SMS, email, webhooks, GitHub Issues, Pushover, ntfy, Gotify, Matrix, Mattermost, Zulip, Pushbullet, PagerTree, Spike.sh, and Trello. The web dashboard provides a visual grid showing real-time status with color-coded badges and per-check integration toggles. Monthly, weekly, and daily email reports summarize uptime trends with checks sorted by downtime duration. Team management supports projects with member roles and read-only access. Prometheus metrics expose check health and grace state for Grafana dashboards. WebAuthn and TOTP two-factor authentication secure accounts. Deploy via Docker images available for amd64, arm/v7, and arm64 architectures. Running on a dedicated VPS on RepoCloud with guaranteed CPU, RAM, and SSD, full root SSH access, and a browser serial console. BSD 3-Clause licensed.