Statping-ng
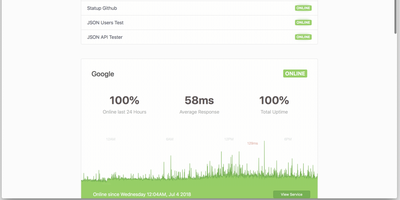
A status page and uptime monitor in one Go binary: Statping-ng - the actively maintained fork of Statping - replaces the UptimeRobot-plus-Statuspage combo with a ~20 MB Docker image using under 50 MB of RAM. It checks services over HTTP, TCP, UDP, ICMP ping, and gRPC health checks on configurable intervals, with per-service timeouts, expected status codes, POST requests with custom JSON bodies, SSL verification, and failure thresholds before alerting. The public status page is the differentiator against plain monitors: visitors see live status, uptime percentages, and latency charts grouped into service categories, with incident announcements and scheduled-maintenance messages you publish from the dashboard - and Sass-based custom styling matches the page to your brand rather than a vendor template. When something fails, notifiers fire immediately: Slack, Discord, Telegram, SMTP email, PagerDuty, Twilio SMS, Pushover, and custom webhooks, each testable before saving. Because notifiers are single Go files, the plugin system makes new channels straightforward. A RESTful API manages services and reads uptime data programmatically, and the free Statping mobile app connects to your server via QR code for on-the-go monitoring. Data persists to SQLite, MySQL, or PostgreSQL. Point it at internal services too - anything the container can reach is monitorable.
CoreObs
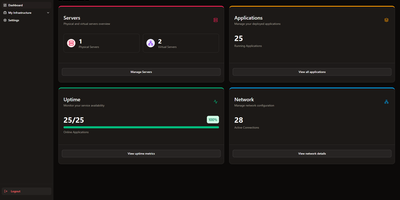
CoreObs delivers a unified self-hosted dashboard that replaces the typical combination of Uptime Kuma, Homer, and separate monitoring tools with a single interface for managing your entire server infrastructure. The Next.js frontend with shadcn components provides a modern dark-themed UI displaying server hardware metrics collected by a lightweight Go agent that leverages Glances for hardware abstraction — streaming real-time per-core CPU load, RAM utilization, NVIDIA GPU statistics, disk usage, system uptime, and load averages via WebSocket connections. The application registry tracks all self-hosted services with configurable uptime monitoring, availability history charts, and instant notifications through Discord, Telegram, Pushover, and email when services go down or recover. Quick-access links provide one-click navigation to each application's management panel directly from the dashboard. The network visualization module built on React Flow enables creating visual topology maps of your infrastructure with drag-and-drop nodes representing servers, switches, and services connected by labeled edges. Server data can be organized with tags, copied between entries, and monitored with configurable pagination and compact view modes. Deploy via Docker Compose with three containers — the Next.js web interface, the Go monitoring agent, and PostgreSQL 17 for persistent storage. Running on a dedicated VPS on RepoCloud with guaranteed CPU, RAM, and SSD, full root SSH access, and a browser serial console. MIT licensed.
Vigil
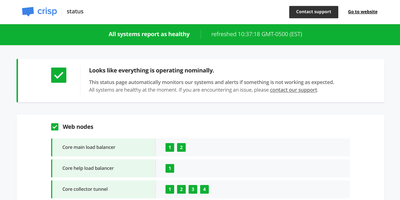
Vigil monitors your entire distributed infrastructure and generates a public status page from a single Rust binary small enough to run on a Raspberry Pi, consuming minimal CPU and memory while providing crash-free reliability. Four distinct monitoring modes cover every topology: poll probes check HTTP, TCP, SSH, and ICMP endpoints for reachability with configurable intervals and thresholds; push probes receive health reports from Vigil Reporter libraries embedded in your application code across Node.js, Python, Golang, Rust, TypeScript, Dart, and C#; local probes delegate monitoring to Vigil Local slave daemons running behind firewalls on separate LANs; and script probes execute custom shell commands for specialized health checks. Each monitored service transitions through healthy, sick, and dead states based on consecutive probe failures, with configurable thresholds controlling state transition sensitivity. When services change state, Vigil dispatches notifications through twelve alert channels including Slack, Email, Twilio SMS, Telegram, Pushover, Gotify, XMPP, Matrix, Zulip, Cisco Webex, and generic webhooks. The generated status page displays service groups organized by category with real-time replica status, system load metrics from reporter probes, and a maintenance announcement system for communicating planned downtime through the Manager HTTP API. Configuration uses a single TOML file defining all probes, services, and notification channels with no database dependency. Docker deployment pulls the official image with volume-mounted configuration. Running on a dedicated VPS on RepoCloud with guaranteed CPU, RAM, and SSD, full root SSH access, and a browser serial console. MPL-2.0 licensed.