Apache SkyWalking
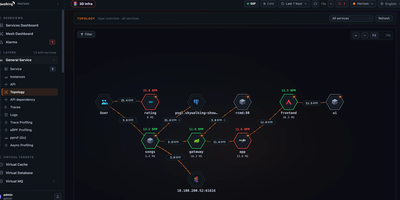
An open-source application performance monitoring platform for microservices, Kubernetes, and service meshes, Apache SkyWalking draws the live service map and ties slow requests to their traces, logs, and metrics. Agents cover Java, .NET Core, PHP, Node.js, Go, Lua, Rust, C++, browser JavaScript, and Python, and OpenTelemetry, Zipkin, Prometheus, Zabbix, and Telegraf data can be ingested too. Start at the service topology map, follow a request through the trace waterfall, then drill into the instance and its API dependencies. When the cause is inside the code, trace profiling, async-profiler, Go pprof, eBPF, and network profiling render flame graphs and process graphs in the same console. The Rover eBPF agent profiles Kubernetes workloads for CPU and network problems, and Istio and Envoy service meshes, including Istio Ambient, report into the same dashboards. Alarm rules target a service, deployment, or API, and alarms and telemetry can be forwarded to third-party systems. Metric and log analysis rules hot-update at runtime without a restart, and a live debugger shows what each rule stage receives and produces. An AI assistant answers plain-language questions with charts, topology, and traces from live data, using an OpenAI-compatible or Amazon Bedrock model you configure, and an MCP connection serves your own AI client. Running on a dedicated VPS on RepoCloud with guaranteed CPU, RAM, and SSD, full root SSH access, and a browser serial console. Apache-2.0 licensed.
Deploy