Categories
Self-Hosted Monitoring Observability Kubernetes Microservices OpenTelemetry APM Distributed TracingStars
Forks
Watchers
Developer links
Apache SkyWalking
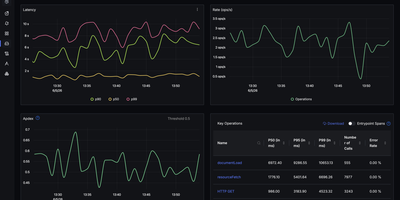
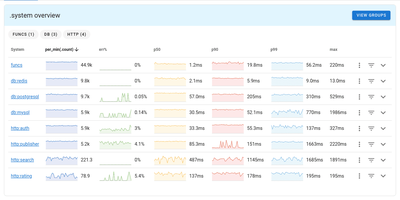
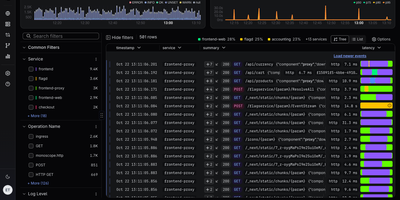
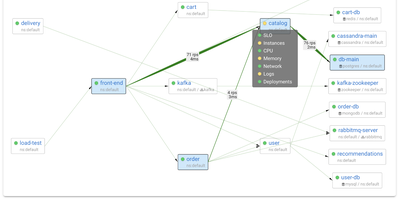
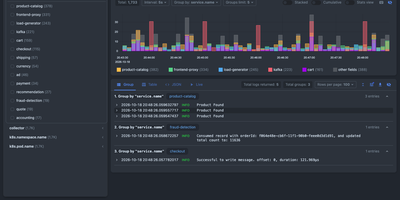
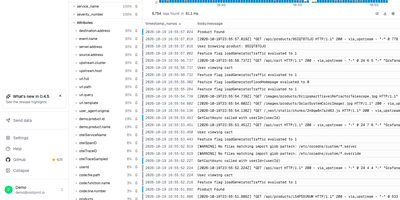
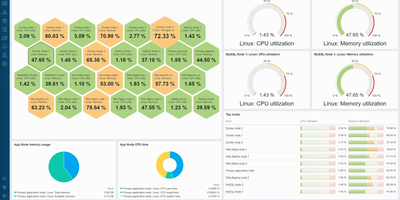
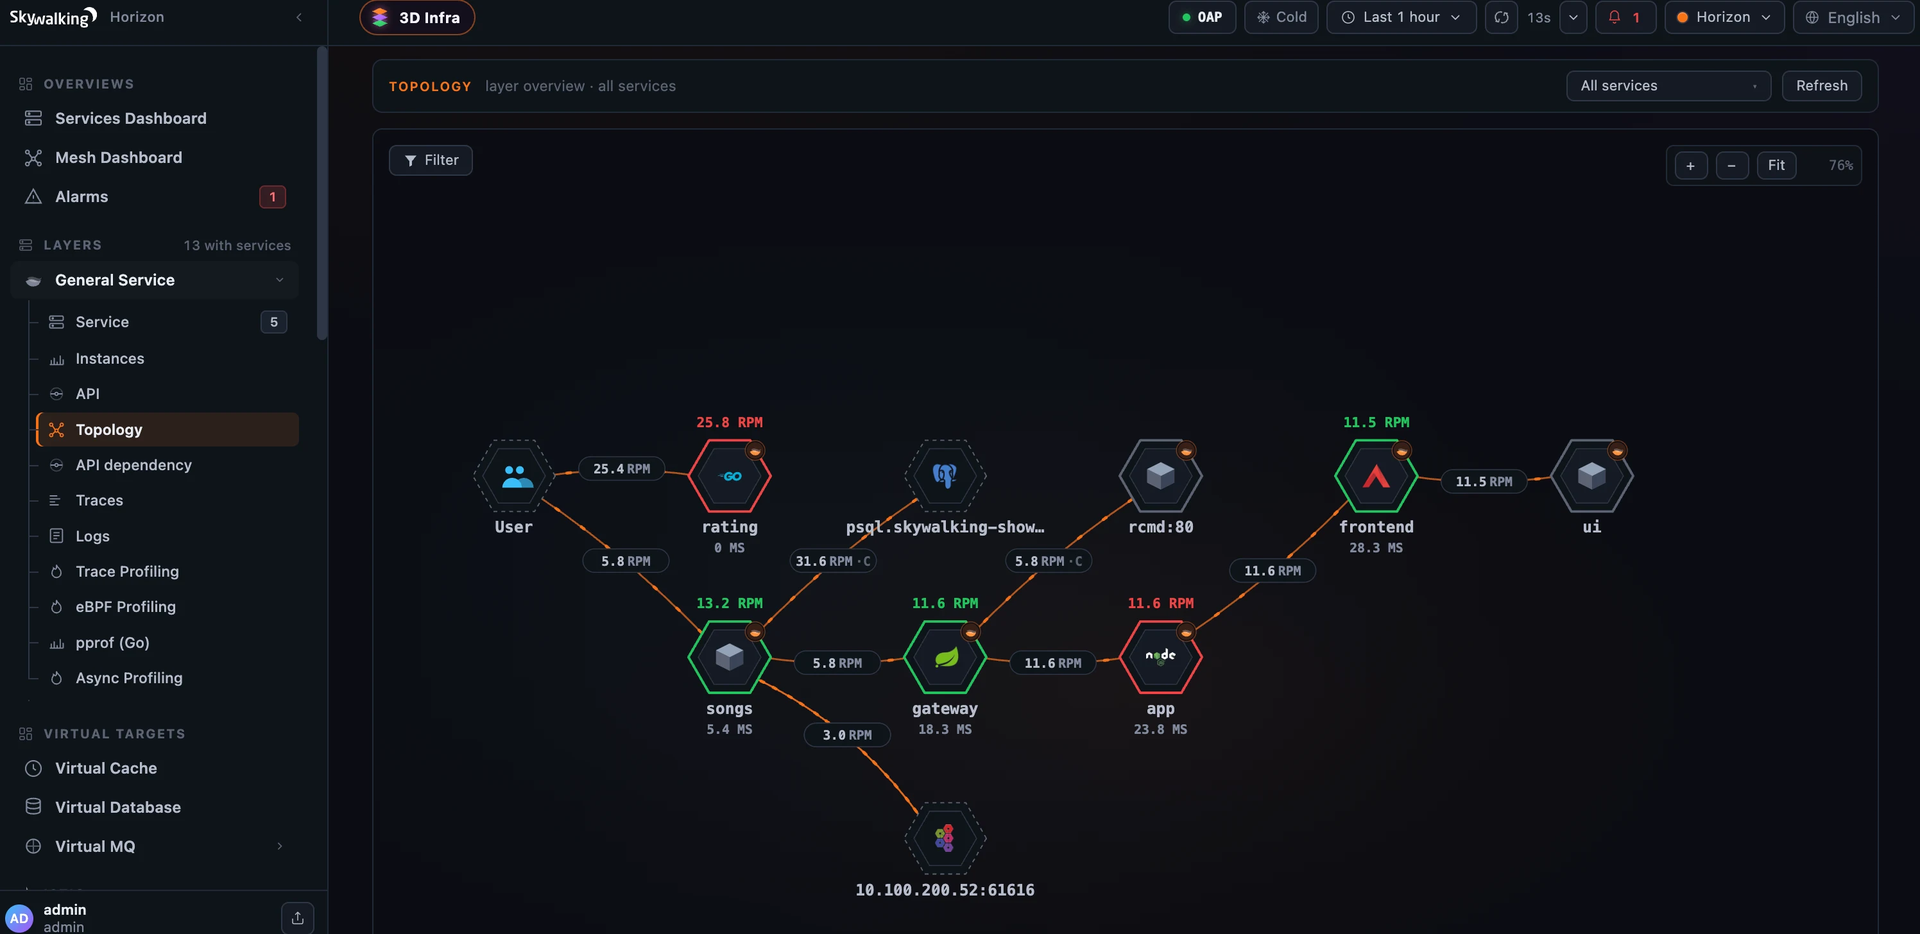
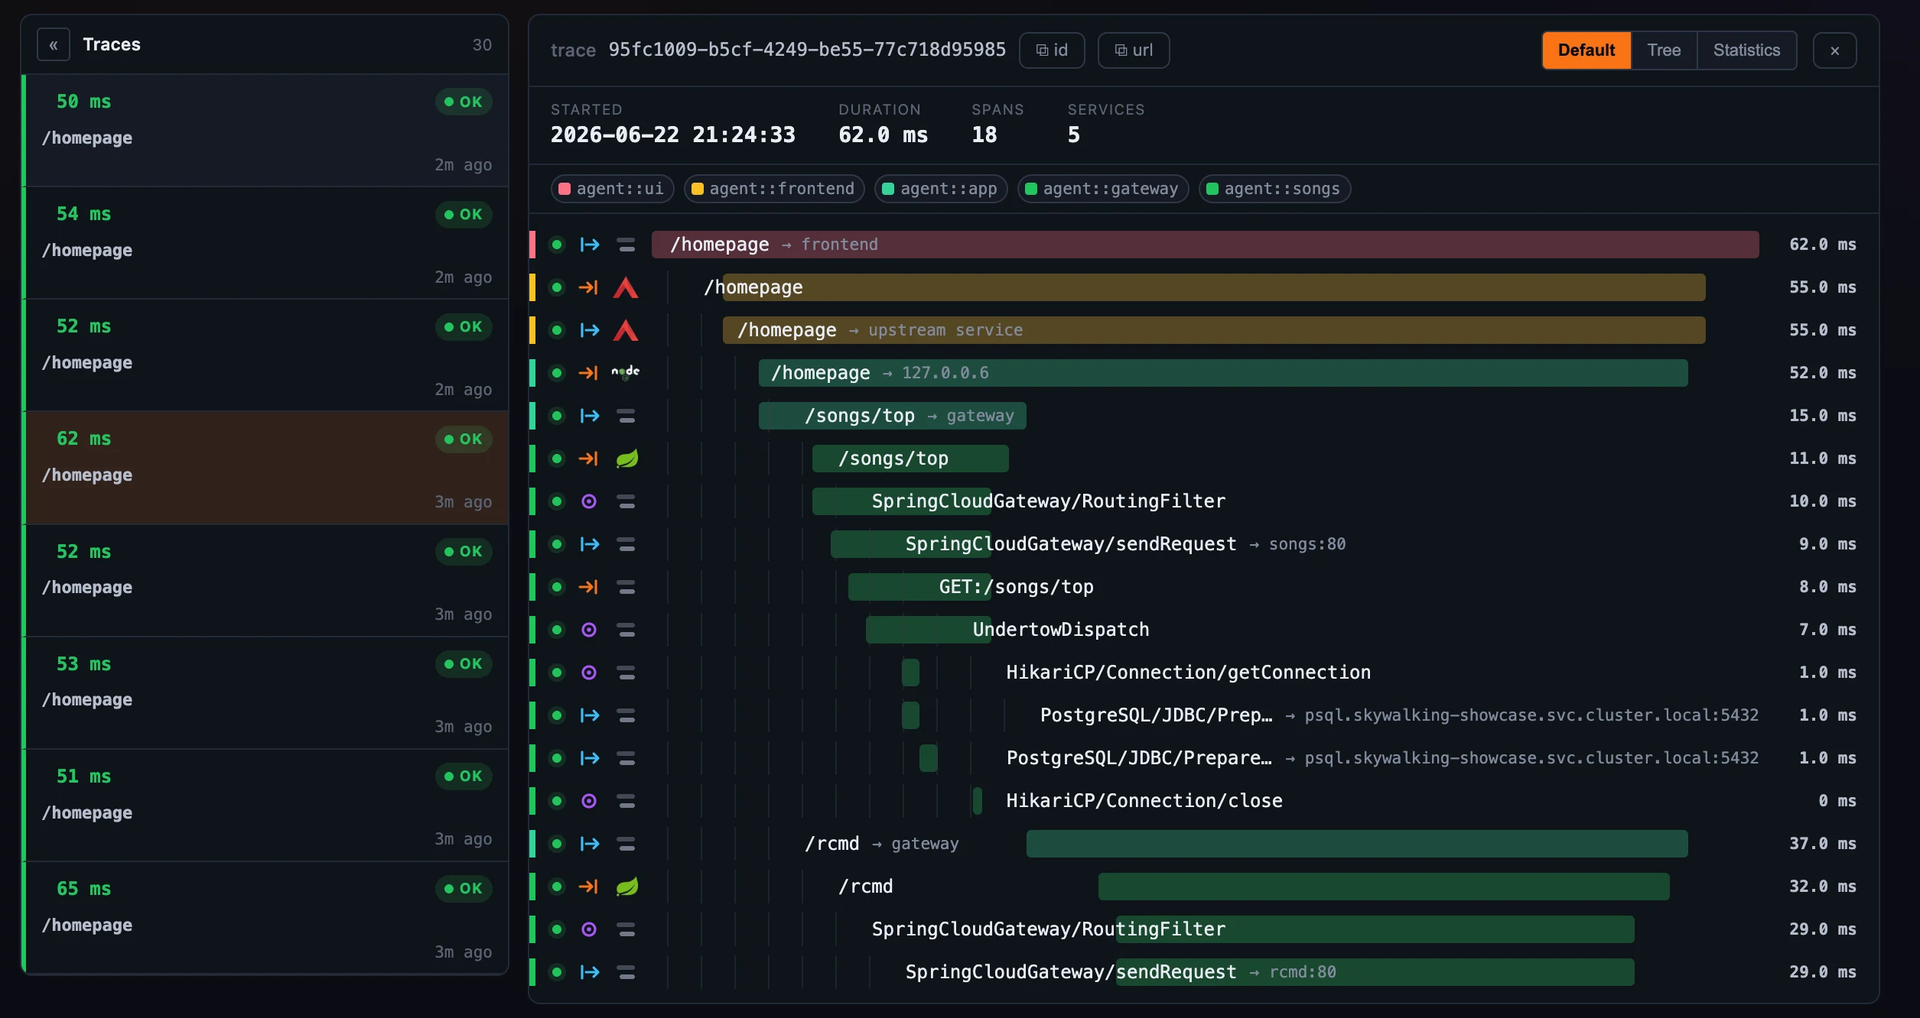
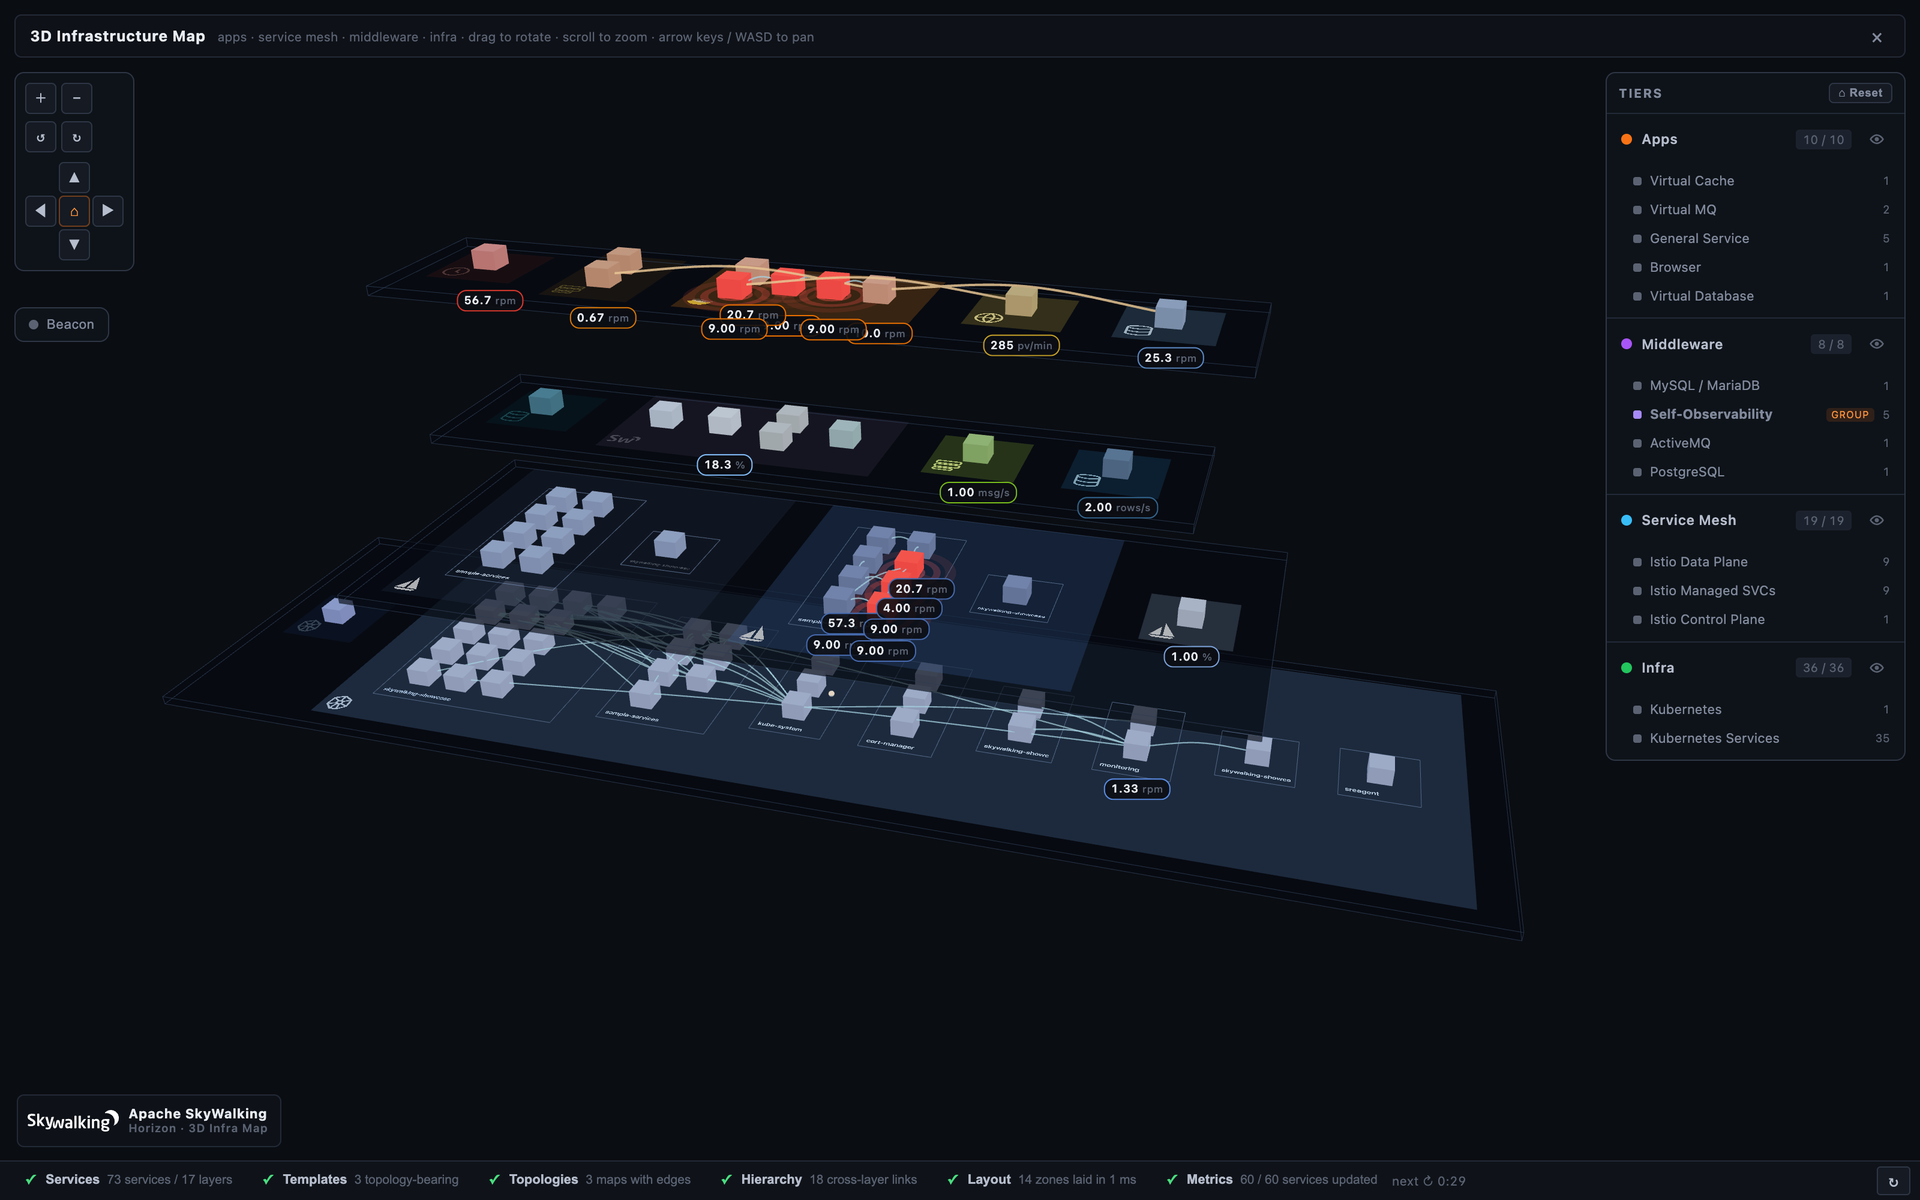
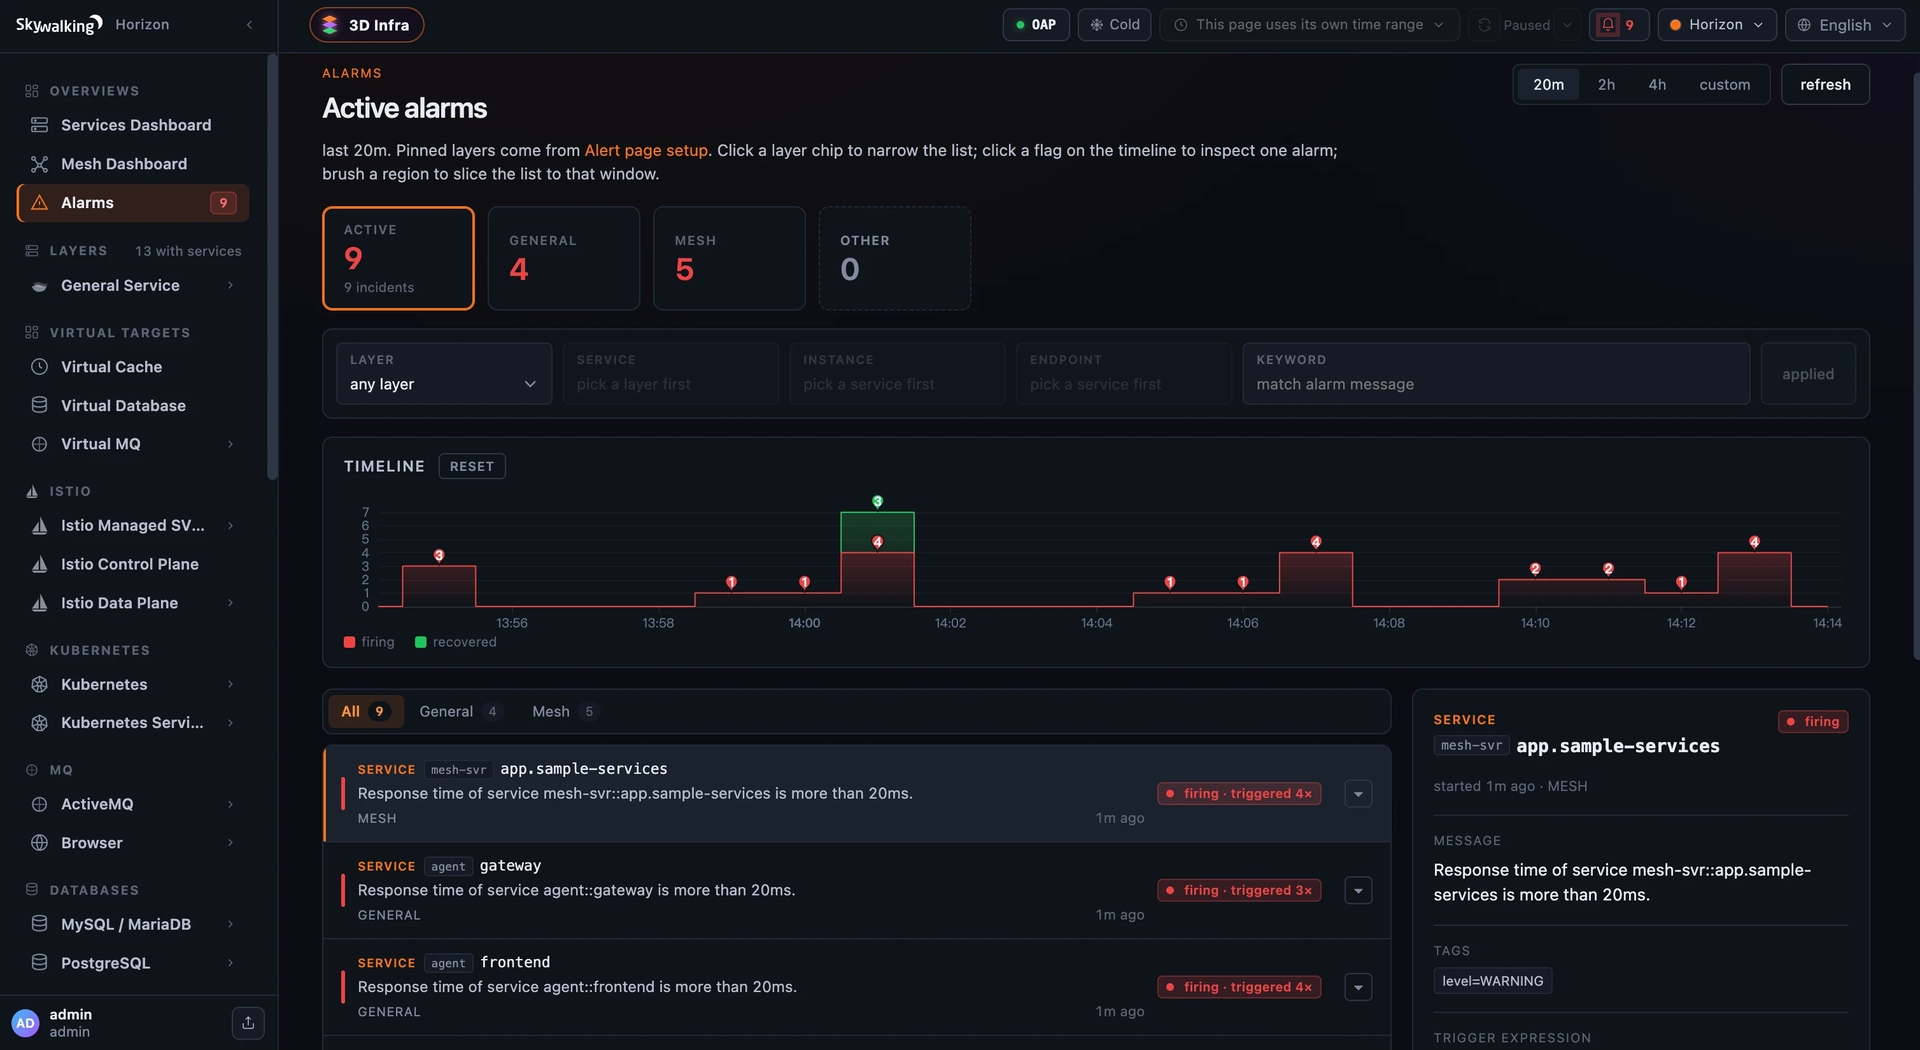
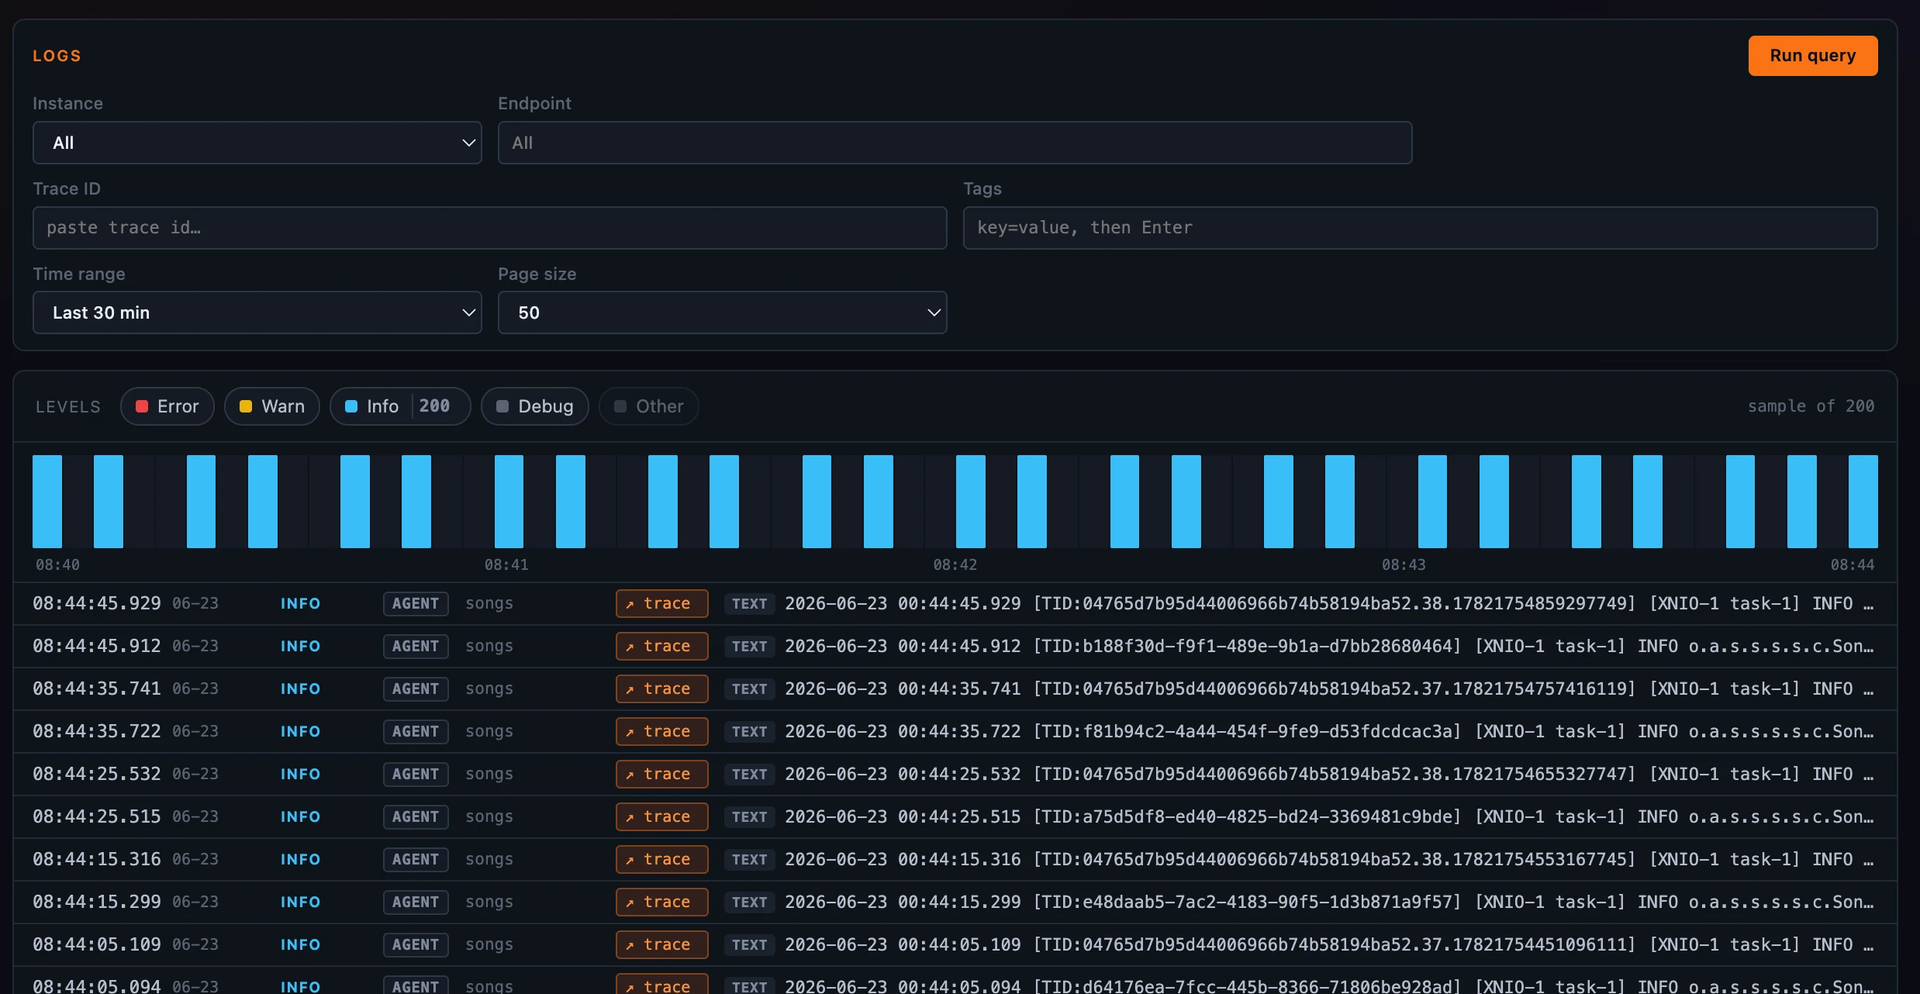
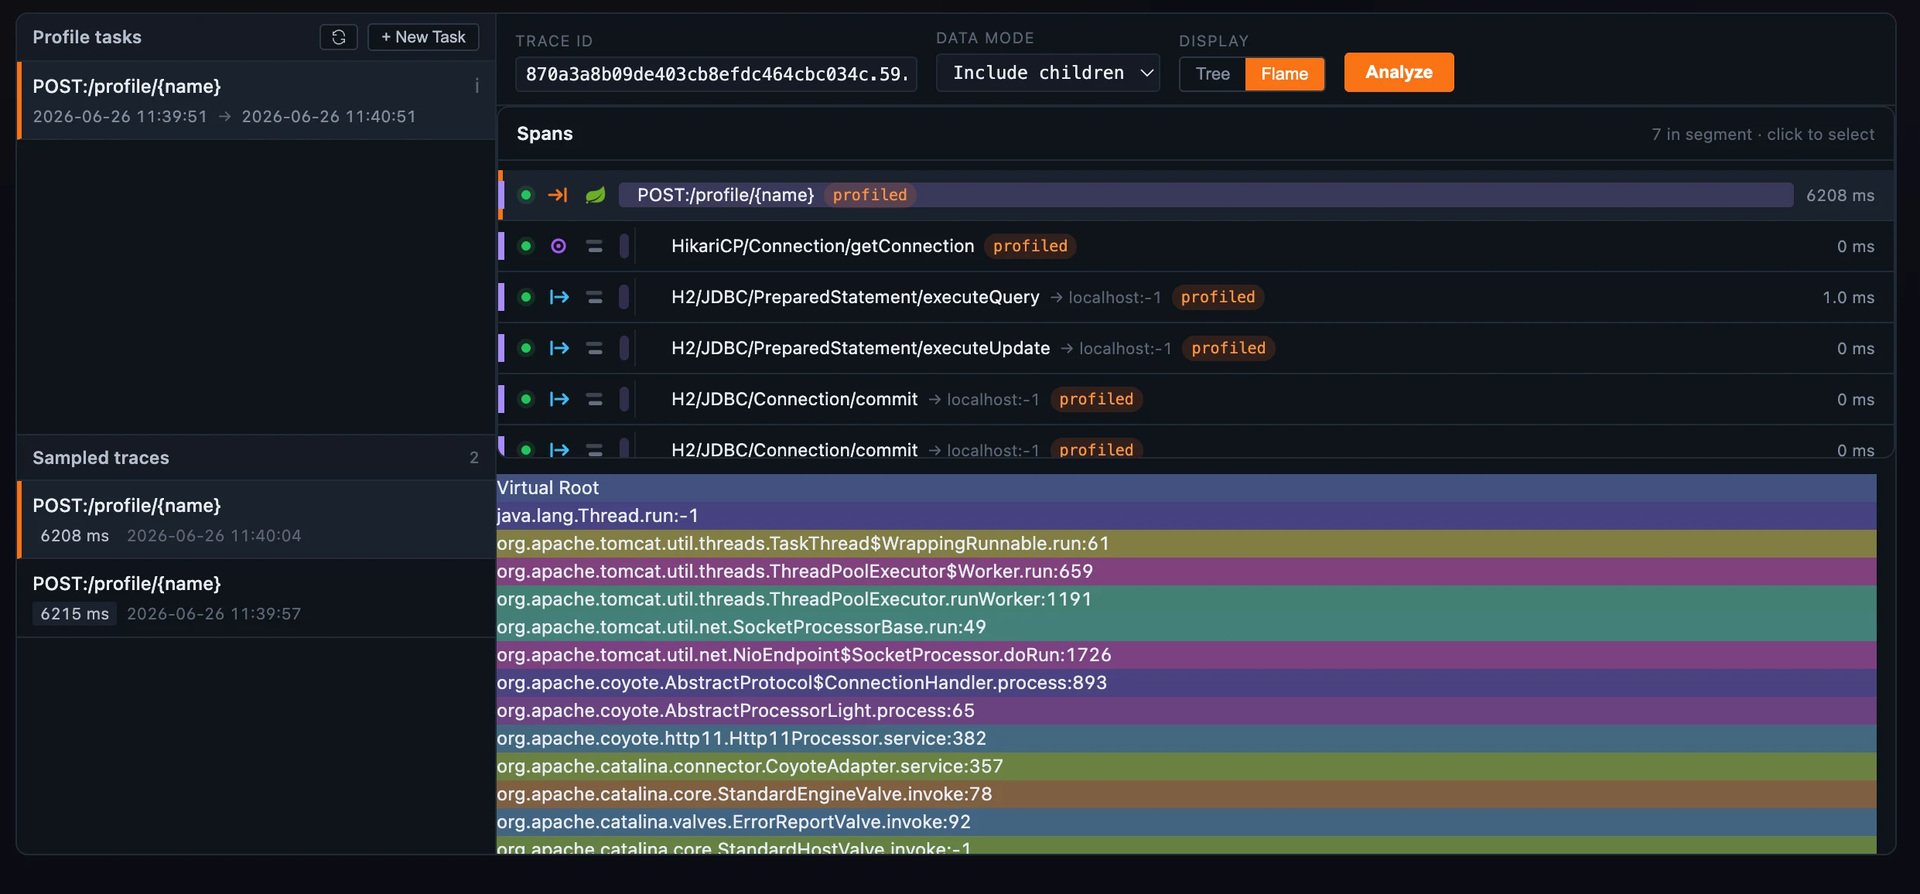
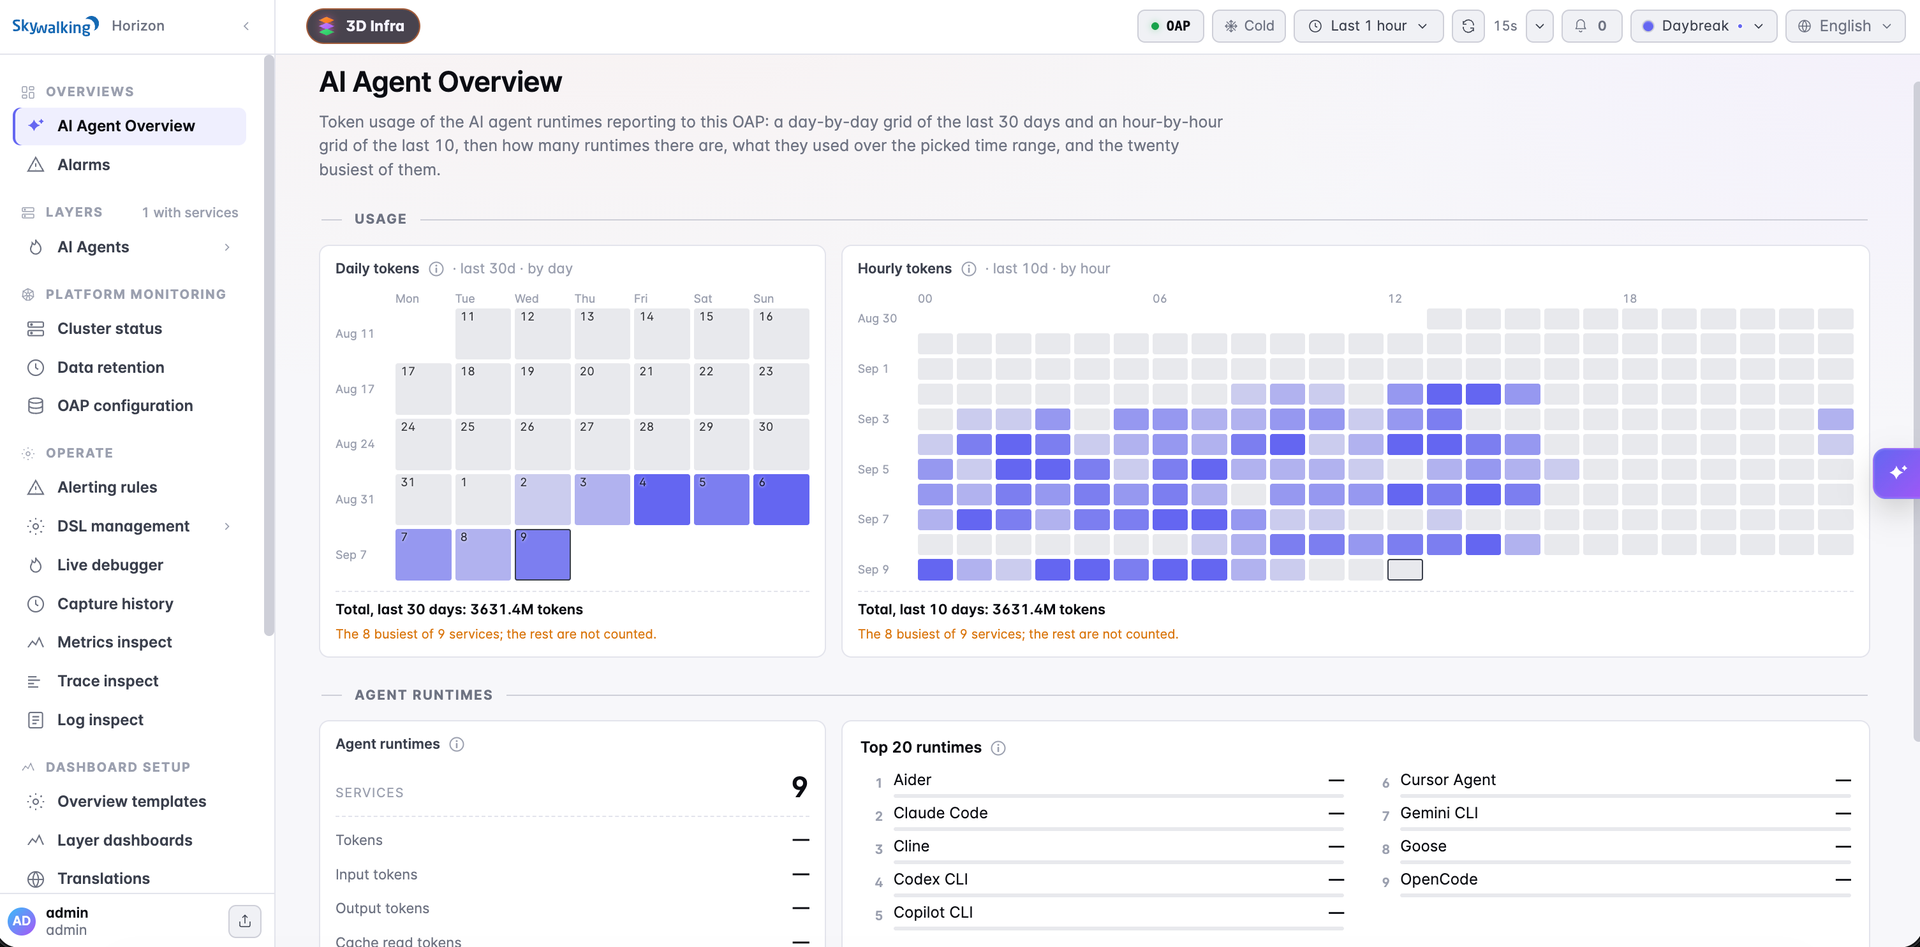
An open-source application performance monitoring platform for microservices, Kubernetes, and service meshes, Apache SkyWalking draws the live service map and ties slow requests to their traces, logs, and metrics. Agents cover Java, .NET Core, PHP, Node.js, Go, Lua, Rust, C++, browser JavaScript, and Python, and OpenTelemetry, Zipkin, Prometheus, Zabbix, and Telegraf data can be ingested too. Start at the service topology map, follow a request through the trace waterfall, then drill into the instance and its API dependencies. When the cause is inside the code, trace profiling, async-profiler, Go pprof, eBPF, and network profiling render flame graphs and process graphs in the same console. The Rover eBPF agent profiles Kubernetes workloads for CPU and network problems, and Istio and Envoy service meshes, including Istio Ambient, report into the same dashboards. Alarm rules target a service, deployment, or API, and alarms and telemetry can be forwarded to third-party systems. Metric and log analysis rules hot-update at runtime without a restart, and a live debugger shows what each rule stage receives and produces. An AI assistant answers plain-language questions with charts, topology, and traces from live data, using an OpenAI-compatible or Amazon Bedrock model you configure, and an MCP connection serves your own AI client. Running on a dedicated VPS on RepoCloud with guaranteed CPU, RAM, and SSD, full root SSH access, and a browser serial console. Apache-2.0 licensed.
Benefits
- Topology Without Manual Mapping
- Language agents and mesh telemetry reveal which services call which, so the service map, endpoint dependencies, and slow hops appear automatically instead of being drawn and maintained by hand.
- One Platform For Every Signal
- Traces, metrics, logs, profiles, and alarms live in the same console, and OpenTelemetry, Zipkin, Prometheus, Zabbix, and Telegraf data can feed it, so teams keep their existing collectors.
- Change Rules Without Restarting
- Metric and log analysis rules are hot-updated at runtime and a live debugger exposes each stage's inputs and outputs, so tuning observability no longer means redeploying the backend.
- Keep Telemetry On Your Server
- Run the OAP server, Horizon UI, and BanyanDB on your own VPS so traces, logs, and metrics never leave your infrastructure, with no per-host or per-GB license fees.
Features
- Distributed Tracing And Topology
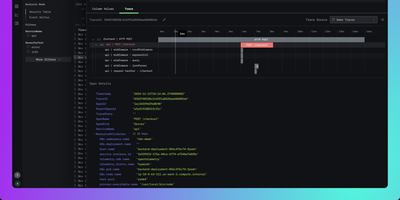
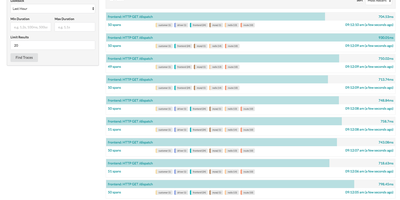
- Follow requests across services with trace waterfalls for native SkyWalking and Zipkin traces, interactive service topology maps, instance drill-downs, and API dependency graphs.
- Multi-Language Agents
- Instrument Java, .NET Core, PHP, Node.js, Go, Lua, Rust, C++, browser JavaScript, and Python services, and ingest OpenTelemetry, Zipkin, Prometheus, Zabbix, and Telegraf telemetry.
- eBPF And Service Mesh
- The Rover eBPF agent profiles Kubernetes workloads for CPU and network problems, while Istio and Envoy service meshes, including Istio Ambient, report into the same dashboards.
- Profiling And Flame Graphs
- Diagnose slow code with trace profiling, async-profiler, Go pprof, eBPF, and network profiling, with results rendered as flame graphs and process graphs inside the console.
- Alarms And Incidents
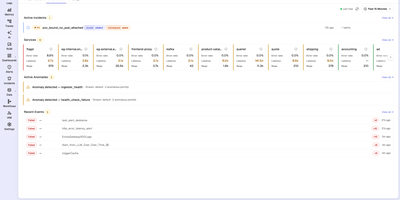
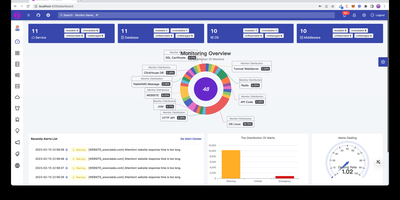
- Define alarm rules per service, deployment, or API, review active alarms and incidents, and forward alarms and telemetry to third-party systems.
- AI Assistant And MCP
- Ask questions in plain language and get charts, topology, and traces drawn from live data, using an OpenAI-compatible or Amazon Bedrock model, or connect an AI client over MCP.