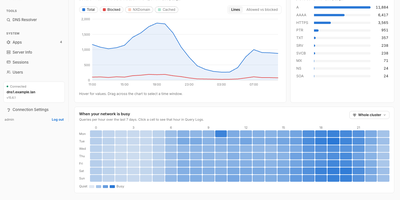
Resolvr DNS Dashboard
Resolvr gives your Technitium DNS server the clean, readable dashboard it deserves, turning raw query traffic into an overview you can understand at a glance. Four tabs divide the picture: Traffic charts queries over time with allowed and blocked stacked together and a seven-day heatmap of when your network is busy; Resolution shows where answers come from, cache, upstream, blocked, or authoritative, with response times and a flow diagram of each lookup; Top lists rank your chattiest clients and most-requested domains; and Infrastructure tracks DHCP scope usage, zones, and cache growth. Every chart is a doorway: click one and you land in Query Logs already filtered to what you clicked. Pick any device on the Clients page to see its queries, block rate, DHCP lease, and favourite domains. Query Logs themselves filter by client, name, protocol, response code, and time window, export to CSV, and can live-tail as new lookups arrive. Blocked Zones manages your feeds, your own blocked domains, and a checker that tells you whether a name is blocked and which feed caught it. Run a Technitium cluster and each panel gains a scope chip, comparing nodes side by side or merging their logs into one timeline. Running on a dedicated VPS on RepoCloud with guaranteed CPU, RAM, and SSD, full root SSH access, and a browser serial console. MIT licensed.
Deploy