Uptrace
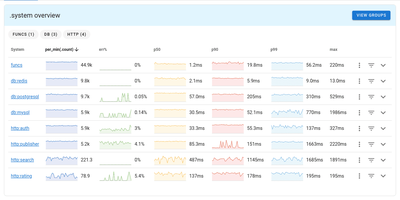
Pinpoint distributed system bottlenecks across polyglot microservices using Uptrace, an open telemetry monitoring platform that correlates traces, metrics, and logs inside a unified diagnostic dashboard. Engineers can track end-to-end request flows across polyglot microservices, inspecting database queries, third-party API calls, and internal function calls with sub-millisecond precision. The platform automatically aggregates spans into high-level latency percentiles, highlighting p50, p90, and p99 bottlenecks while calculating baseline error rates across production deployments. Integrated log correlation links log entries directly to parent trace spans, eliminating the friction of manual search across separate monitoring tools during active outages. You can construct custom dashboard views using a visual query builder, monitor cluster nodes, and map out upstream and downstream service dependencies with interactive topological graphs. Automated alerting channels notify on-call teams via Slack, Telegram, webhooks, or email whenever error budgets or metric thresholds trigger an incident. Running on a dedicated VPS on RepoCloud with guaranteed CPU, RAM, and SSD, full root SSH access, and a browser serial console. AGPL-3.0 licensed.
Deploy