OpenCharts
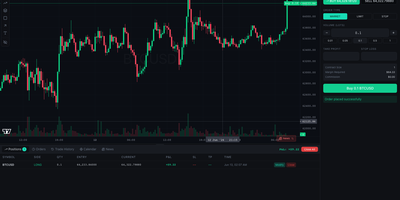
OpenCharts puts a full trading terminal in your browser, with candlestick charts, drawing tools, indicators, and a paper-trading account funded with one hundred thousand dollars. You switch between eight timeframes from one minute to one week, overlay volume, bid and ask lines, and a bar countdown, then add SMA, EMA, RSI, MACD, Bollinger Bands, ATR, Stochastic, or VWAP studies from the toolbar. The drawing rail covers trend lines, rays, channels, Fibonacci retracement and extension, shapes, and text, with magnet snapping to price levels and an object tree that manages every annotation. Position tools calculate risk, reward-to-risk ratio, and position size against live account equity as you drag them across the chart. Market, limit, and stop orders rest in the book, trigger on price ticks, and honor take-profit and stop-loss levels you can drag directly on the chart. Positions mark to market on every tick, and the panels track equity, balance, used margin, and free margin in real time. Session replay rewinds one-minute history and plays it forward at up to ten times speed, so you can rehearse entries against past price action. A trade journal records notes, tags, emotions, and ratings per trade, filtered by symbol when you review the week. Running on a dedicated VPS on RepoCloud with guaranteed CPU, RAM, and SSD, full root SSH access, and a browser serial console. MIT licensed.
Deploy