SaaS Alternative
TradingViewCategories
Trading Terminal Candlestick Charts Crypto Trading Technical Analysis Paper Trading Finance ToolsStars
Forks
Watchers
Developer links
OpenCharts
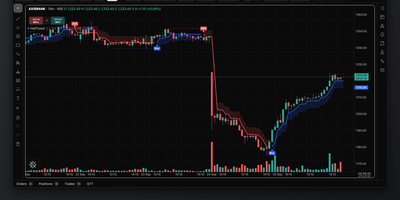
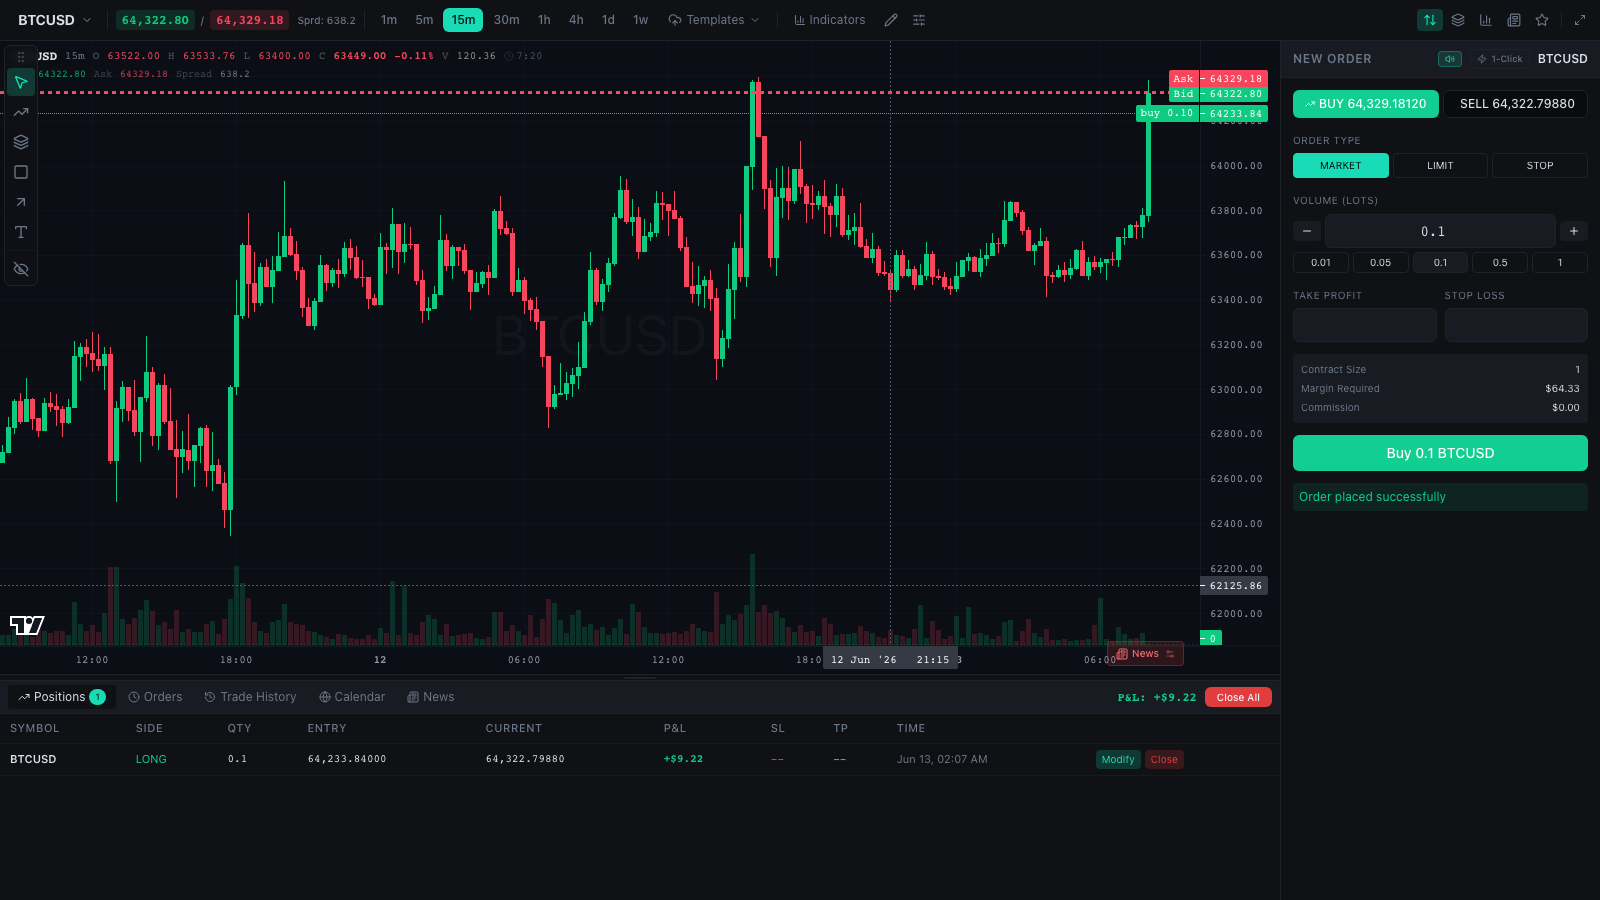
OpenCharts puts a full trading terminal in your browser, with candlestick charts, drawing tools, indicators, and a paper-trading account funded with one hundred thousand dollars. You switch between eight timeframes from one minute to one week, overlay volume, bid and ask lines, and a bar countdown, then add SMA, EMA, RSI, MACD, Bollinger Bands, ATR, Stochastic, or VWAP studies from the toolbar. The drawing rail covers trend lines, rays, channels, Fibonacci retracement and extension, shapes, and text, with magnet snapping to price levels and an object tree that manages every annotation. Position tools calculate risk, reward-to-risk ratio, and position size against live account equity as you drag them across the chart. Market, limit, and stop orders rest in the book, trigger on price ticks, and honor take-profit and stop-loss levels you can drag directly on the chart. Positions mark to market on every tick, and the panels track equity, balance, used margin, and free margin in real time. Session replay rewinds one-minute history and plays it forward at up to ten times speed, so you can rehearse entries against past price action. A trade journal records notes, tags, emotions, and ratings per trade, filtered by symbol when you review the week. Running on a dedicated VPS on RepoCloud with guaranteed CPU, RAM, and SSD, full root SSH access, and a browser serial console. MIT licensed.
Benefits
- Practice trading without risk
- A paper account with one hundred thousand dollars, hundred-times leverage, and a real order lifecycle where you rehearse entries, stops, and position sizing before any real money moves.
- Real history, live feel
- Bundled candles come from genuine exchange history and replay forward as a tick stream, so practice sessions react to real market structure instead of random simulated price walks.
- Professional drawing toolkit
- Trend lines, channels, Fibonacci tools, shapes, and text annotations snap magnetically to open, high, low, and close levels, with per-object styling and an object tree for control.
- Point it at your backend
- One adapter interface connects the terminal to your own market-data and trading services, so the interface you practice on can become the interface you actually trade through later.
Features
- Candlestick charting engine
- Lightweight Charts renders up to one thousand bars across eight timeframes with volume histograms, bid and ask lines, crosshair plugins, and saveable chart templates.
- Eight built-in indicators
- SMA, EMA, RSI, MACD, Bollinger Bands, ATR, Stochastic, and VWAP attach from the toolbar and remove individually or in bulk from the chart menu.
- Depth of market
- A price ladder around the live mid price sits beside the watchlist and order ticket, with market, limit, and stop tickets plus one-click trade mode.
- Session replay mode
- One-minute history replays at half to ten times speed with a seek scrubber, revealing bars progressively and marking trades closed inside the replayed window.
- Line-cross alerts
- Horizontal lines and trend lines can fire an in-session toast and sound the moment mid price crosses them, turning drawings into active level monitors.
- Trade journal records
- Per-trade entries capture notes, tags, emotion, and a rating, scoped to the account and filterable by symbol for structured review of past decisions.