Kula
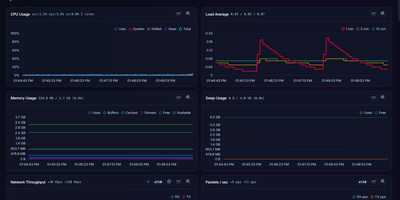
Kula watches a Linux server every second and turns CPU, memory, disks, network, containers, and applications into a live dashboard you can open before trouble becomes downtime. Follow total and per-core CPU, load averages, memory and swap pressure, disk I/O, filesystem space, temperatures, GPU load, and network throughput as charts update live in the browser. Drag to zoom into history, switch to focus or TV mode for a wall display, and check the System Info page when you need the hardware story behind a spike. Watch Docker, Podman, and cgroup containers beside host metrics, then add PostgreSQL, MySQL or MariaDB, nginx, and Apache monitoring or define custom metrics for the odd service only your team understands. Scrape the Prometheus endpoint into an existing observability stack, open the terminal UI over SSH for a quick live read, or ask the optional local Ollama assistant to discuss charts without sending data to a cloud service. Protect the dashboard with optional Argon2id logins and multiple users, schedule storage snapshots, and keep the whole tool working on closed networks with no external calls. Running on a dedicated VPS on RepoCloud with guaranteed CPU, RAM, and SSD, full root SSH access, and a browser serial console. AGPL-3.0 licensed.
Deploy