Pyrra
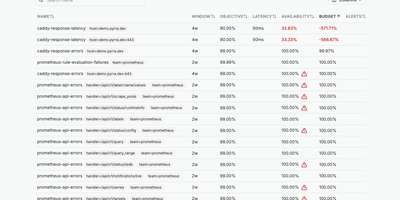
Define a service level objective in a few lines of YAML and Pyrra writes the Prometheus recording rules and multi-window burn rate alerts for it, then tracks the remaining error budget in a web interface. An objective can be an error ratio or a latency target, declared as a Kubernetes custom resource or as a plain file read from disk when running under Docker or as binaries. Grouping labels fan one definition out into an objective per route or handler. The objectives page lists each SLO with its window, target, availability, and remaining budget, sorted so the worst offenders sit on top; columns can be sorted or hidden, and a search box or a click on any label filters the list. Opening an objective highlights availability and error budget, plots the budget over time, and charts requests, errors, and duration with a time range picker and absolute or relative scales. Below the charts, a table shows the four generated alerts with their severities. Generated alerts carry a link back to the objective's page, and severities can be overridden in the spec. Queries go to Prometheus, Thanos, or Mimir, with basic auth, bearer tokens, or tenant IDs, and ready-made Grafana dashboards chart the same objectives. Running on a dedicated VPS on RepoCloud with guaranteed CPU, RAM, and SSD, full root SSH access, and a browser serial console. Apache-2.0 licensed.
Deploy