Statlite
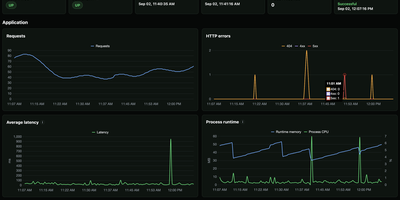
Small server, small monitoring. Statlite watches your applications and their host with a single binary that idles at about 15 MiB, so the observer never becomes the heaviest thing on the box. Point it at a Spring Boot Actuator endpoint and it polls health plus a fixed, curated set of Micrometer metrics: request traffic, latency, CPU, and runtime memory, all drawn as clean charts. Quarkus, Micronaut, and anything else that can answer a fixed JSON metrics profile can join the same dashboard. History lives in one local SQLite file, raw samples only, kept for 90 days by default, so yesterday's latency spike is still there when you go looking. The dashboard also watches the host itself: processor load, memory pressure, and filesystem capacity, including a warning before the metrics database fills its own disk. Restart detection tells you when an application bounced, and per-target Basic Auth support lets you poll protected Actuator endpoints safely. Configuration is one YAML file listing your targets and polling interval, friendly to systemd and Docker alike. Everything is deliberately scoped: no alert manager, no external service, no observability platform to operate. Just open the page and see whether your apps are healthy. Running on a dedicated VPS on RepoCloud with guaranteed CPU, RAM, and SSD, full root SSH access, and a browser serial console. MIT licensed.
Deploy