OpsiMate
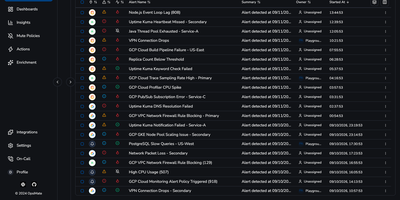
OpsiMate gives on-call teams one queue for alerts that would otherwise arrive in five different dashboards, each demanding attention in its own tab. Connect Grafana, Datadog, Zabbix, Uptime Kuma, Google Cloud, or any custom webhook source and watch incoming alerts land in one table with their source, service, severity, tags, and status attached. Filter the noise down to the team or service you own, group related alerts so one incident does not look like forty separate emergencies, and use mute policies when a known problem should stop paging people. Acknowledge work with one click, assign ownership so nobody wonders who is responding, resolve alerts from the same screen, and follow deep links back into Grafana or Zabbix when you need the original chart or trigger. Let supported integrations auto-resolve alerts when the underlying monitor recovers, and use root-cause notes and insights to keep the next responder from starting at zero. Discover services running in Docker, Kubernetes, and Linux virtual machines so the alert queue stays connected to the infrastructure behind it. Running on a dedicated VPS on RepoCloud with guaranteed CPU, RAM, and SSD, full root SSH access, and a browser serial console. AGPL-3.0 licensed.
Deploy