Grafana Loki
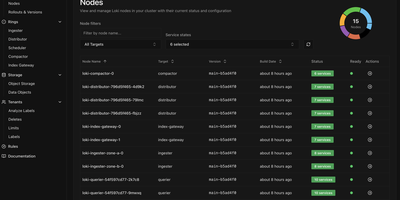
With over 28,600 GitHub stars and 450 contributors, Grafana Loki is the log aggregation system that takes the Prometheus approach to logging — indexing only metadata labels instead of full log content, making it dramatically cheaper and simpler to operate than traditional log management platforms. The label-based indexing strategy groups log streams using the same labels already applied to Prometheus metrics, enabling seamless switching between metrics and logs in Grafana dashboards without maintaining separate indexing infrastructure. Grafana Alloy, the telemetry collector replacing Promtail, scrapes and pushes logs with Prometheus-style service discovery, automatic Kubernetes Pod label extraction, and pipeline stages for parsing, filtering, and relabeling before ingestion. LogQL, the query language, combines label matchers for stream selection with regex line filters and aggregation functions, supporting rate calculations, pattern parsing, and metric generation from log data for alerting and dashboard panels. The storage architecture writes compressed log chunks and TSDB indexes to S3, GCS, Azure Blob Storage, or MinIO-compatible object stores, with configurable retention and compaction policies. Deployment modes scale from a single binary for development through monolithic high-availability mode with multiple replicas to full microservices decomposition with separate ingester, distributor, querier, query-frontend, compactor, and ruler components on Kubernetes via Helm charts. Multi-tenancy isolates data and query paths per tenant through header-based tenant ID assignment. Running on a dedicated VPS on RepoCloud with guaranteed CPU, RAM, and SSD, full root SSH access, and a browser serial console. AGPL-3.0 licensed.
Deploy