CrowdSec Web UI
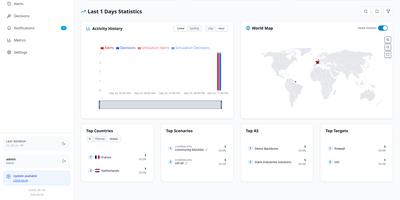
CrowdSec Web UI provides a centralized web console for monitoring intrusion detection telemetry, managing firewall remediation decisions, and auditing security events across multiple CrowdSec security engines. Administrators can connect several CrowdSec Local API endpoints simultaneously, aggregating threat intelligence and active bans into a unified visual interface. The dashboard displays geographic origins of attacking IP addresses, active remediation durations, and specific scenario triggers such as brute-force authentication attacks or web vulnerability probes. Operators can search through historical alert logs, inspect raw HTTP request details, and drill down into individual IP behaviors to differentiate authentic threats from false positives. Manual intervention tools let security teams enforce custom IP bans, adjust expiration timers, or immediately revoke erroneous bans across all connected bouncers with a single click. Integrated notification pipelines dispatch real-time security alerts to external destinations including ntfy, Gotify, and MQTT message brokers whenever critical thresholds are breached. Built-in Prometheus metrics dashboards visualize processing latencies, parser throughput, and decision counts over customizable time windows. Running on a dedicated VPS on RepoCloud with guaranteed CPU, RAM, and SSD, full root SSH access, and a browser serial console. AGPL-3.0 licensed.
CrowdSec
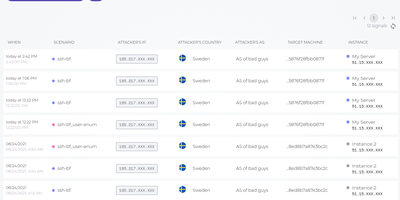
With over 14,000 GitHub stars and a growing global network of security deployments, CrowdSec turns every attack on any participating server into protection for the entire community. The security engine operates as a combined IDS/IPS and WAF, analyzing log sources from Nginx, Apache, SSH, WordPress, and over 50 other services to detect brute force attacks, port scans, web vulnerability exploitation, and credential stuffing in real time. When one server detects a new threat, the attacker's IP is shared through the community blocklist, proactively protecting thousands of other installations before the attacker can reach them. The built-in WAF powered by Coraza v3 inspects HTTP requests at the application layer, validates against OpenAPI schemas, and applies custom rules with flexible AND/OR condition mixing for precise threat detection. Bot detection serves challenge pages with client fingerprinting to distinguish legitimate traffic from automated scrapers and scanners. Remediation components block malicious IPs at multiple infrastructure layers including iptables, nftables, Nginx, HAProxy, Cloudflare, and AWS Security Groups through the detect-here-remedy-there architecture. The scenario-based detection system ships with default rules for common attack patterns and supports custom scenarios written in YAML with an expressive filter language. A centralized console provides real-time visualization of alerts, threat intelligence analysis, and management of multiple distributed security engines. GDPR compliant by design, all log analysis happens locally and raw logs never leave your infrastructure. Running on a dedicated VPS on RepoCloud with guaranteed CPU, RAM, and SSD, full root SSH access, and a browser serial console. MIT licensed.

Pipelock
Your AI coding agent has your API keys in its environment and unrestricted network access, which means one prompt injection away from sending those secrets anywhere. Pipelock closes that gap by sitting as a proxy between your agents and every outbound connection, scanning the actual content of HTTP, WebSocket, MCP, and Agent-to-Agent traffic before it leaves your server. An 11-layer scanner pipeline checks every request against 62 credential patterns covering AWS, GCP, Azure, GitHub, OpenAI, Anthropic, SSH keys, and database URLs, then inspects every response for prompt injection using 29 detection patterns with six-pass normalization that catches base64-encoded, leetspeak, and whitespace-obfuscated payloads. The MCP proxy wraps any Model Context Protocol server (stdio, HTTP, or WebSocket) with bidirectional scanning that detects tool description poisoning and mid-session rug-pull changes via SHA-256 fingerprinting. Every scanning decision produces a cryptographically signed action receipt that third parties can verify offline without trusting the agent or the vendor. The Operator Console provides a web dashboard for reviewing evidence scorecards, receipt timelines, agent sessions, enforcement decisions, and fleet posture at a glance. Cross-request taint tracking catches slow-drip exfiltration attempts that spread a secret across multiple calls. Canary tokens plant synthetic secrets that trip alerts the moment an agent tries to exfiltrate them. Pre-built Prometheus metrics and a Grafana dashboard provide real-time visibility into traffic volumes and block rates. Deploy on a dedicated VPS on RepoCloud with guaranteed CPU, RAM, and SSD, full root SSH access, and a browser serial console. Apache 2.0 licensed.