Graylog
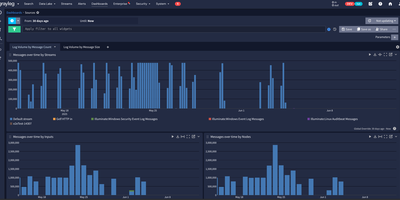
Trusted by over 60,000 organizations worldwide with more than 8,100 GitHub stars since 2010, Graylog has established itself as one of the fastest paths from raw log data to operational visibility, delivering centralized log management, security analytics, and compliance auditing through a purpose-built web interface with sub-second search at scale. The platform ingests logs from virtually any source via syslog, GELF, Beats, raw TCP/UDP, HTTP, CEF, IPFIX, and Netflow protocols, processing each message through configurable pipelines that parse fields, apply transformations, enrich events with GeoIP data from MaxMind or IPinfo lookup tables, and route messages to appropriate streams based on content rules. OpenSearch handles full-text indexing and storage with dynamic shard sizing that automatically calculates appropriate sizes from available node memory, while MongoDB stores configuration metadata including user accounts, roles, dashboards, alert rules, and pipeline definitions. The alerting system integrates with Slack, PagerDuty, and email with customizable notification templates and Replay Search links for immediate investigation context. Version 7.0 introduced MCP server integration for connecting preferred LLMs to perform AI-assisted log analysis and automation, while version 7.1 added Sigma detection rule import from private GitHub, GitLab, and Bitbucket repositories for detection-as-code workflows. The Sidecar agent management system centrally configures and deploys Filebeat, Winlogbeat, and nxlog collectors across infrastructure from the Graylog web interface. Running on a dedicated VPS on RepoCloud with guaranteed CPU, RAM, and SSD, full root SSH access, and a browser serial console. SSPL licensed.
Yopass
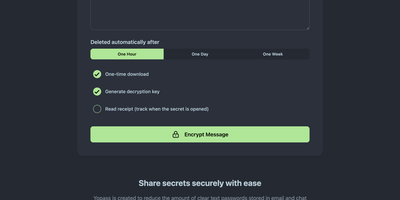
With nearly 3,000 GitHub stars and active development since 2014 through version 14.2.0, Yopass eliminates the universal bad habit of sharing passwords and API keys through Slack messages, email threads, and ticket systems by encrypting secrets entirely in the browser using OpenPGP before anything reaches the server. The Go backend stores only ciphertext — it never sees plaintext — while the React frontend handles all encryption and decryption client-side, generating one-time URLs that self-destruct after a single viewing or when the configured expiration of one hour, one day, or one week passes. File upload support streams encrypted files with configurable size limits, and optional custom password protection adds a second encryption layer beyond the URL-embedded key. The server supports Redis or Memcached as storage backends with automatic key expiration, deploying via Docker Compose in under five minutes or as Kubernetes manifests for production environments. Built-in TLS support works alongside reverse proxy configurations for Nginx, Caddy, and Traefik with automatic Let's Encrypt certificate provisioning. Prometheus metrics expose HTTP request counts, latency histograms, and secret lifecycle counters for Grafana dashboard integration and alerting. Read-only mode enables split-instance deployments separating secret creation from retrieval across different network zones. Multi-language support localizes the interface for international teams. The open-source core under Apache 2.0 provides full self-hosted functionality with no account management required. Running on a dedicated VPS on RepoCloud with guaranteed CPU, RAM, and SSD, full root SSH access, and a browser serial console. Apache-2.0 licensed.

Opengeni
Enterprises requiring production-grade governance for long-running autonomous AI operations can rely on OpenGeni, a self-hosted orchestration platform with human-in-the-loop approvals, Connected Machine execution, and comprehensive audit replays. Operators can configure durable multi-turn workflows that execute continuously toward specified goals without premature termination, automatically pausing when human verification, structured multiple-choice decisions, or critical credential approvals are required. Teams can assign execution workloads across ephemeral cloud sandboxes or route them straight to enrolled Connected Machines to run commands directly against local code repositories without exposing inbound network ports. The integrated web console lets developers inspect live Server-Sent Event activity streams, replay complete turn histories from audit logs, inspect generated artifacts, and cancel or steer in-flight agent tasks on demand. Platform administrators can enforce fine-grained access policies through GitHub App repository bindings, broker temporary role-scoped secrets, and maintain a shared organizational knowledge base where agents propose findings for human review before vector indexing. Running on a dedicated VPS on RepoCloud with guaranteed CPU, RAM, and SSD, full root SSH access, and a browser serial console. Apache-2.0 licensed.
Checkcle
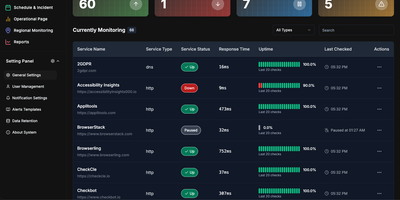
CheckCle provides a complete uptime monitoring and infrastructure observability platform that deploys with a single Docker container and stores all data in embedded SQLite via PocketBase. The Go backend runs three microservices — a service operation engine handling HTTP, HTTPS, DNS, Ping, and TCP checks at configurable intervals, a distributed regional check agent for multi-location network testing, and a server monitoring agent collecting CPU, RAM, disk usage, and network metrics via gRPC. The React frontend built with Vite, TypeScript, Tailwind CSS, and shadcn-ui subscribes to PocketBase WebSocket endpoints for real-time dashboard updates without polling. SSL and domain monitoring tracks certificate issuers, expiration dates, days remaining, and validation status. The incident management system records UP, DOWN, WARNING, and PAUSE states with full history, while scheduled maintenance windows prevent false alerts during planned downtime. Public status pages provide external stakeholders with live service health information. Health heatmaps visualize uptime performance and outage patterns over time. Notification channels include email, Telegram, Discord, and Slack, with multiple alert targets per monitored service. The one-click agent installation script supports Debian, Ubuntu, CentOS, Red Hat, Alpine, and Windows in beta. Docker deployment runs on port 8090 with a single persistent volume at /mnt/pb_data, requiring minimum 1 vCPU and 500MB RAM. On RepoCloud, deploy CheckCle on a dedicated VPS with root SSH access, persistent storage for your monitoring database, and complete control over agent endpoints and notification configurations, all under the MIT license.
Komodo
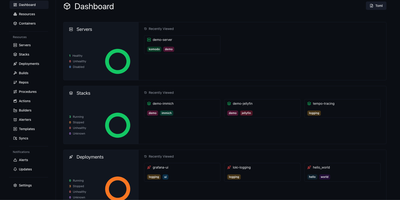
Komodo puts every server, container, and deployment pipeline behind a single dashboard where you build, ship, and monitor Docker workloads across unlimited hosts. Lightweight stateless agents install on each connected server and report CPU, memory, and disk metrics back to the Rust-powered core, giving you real-time visibility without heavyweight monitoring stacks. Docker Compose stacks deploy directly from the UI or link to Git repositories with webhook-triggered automatic redeploys on push. A built-in CI pipeline compiles versioned Docker images from source, with optional AWS spot instances for burst build capacity. For orchestration at scale, Docker Swarm management handles node configuration, service deployment, and multi-node stack orchestration from the same control plane. Browser terminal sessions open persistent named shells on servers and inside containers, complete with shared team access and scriptable Actions that chain executions into multi-stage procedures. Infrastructure-as-code support defines all resources declaratively in TOML files within a Git repository, keeping production state version-controlled and auditable. Granular role-based access control with user groups, per-resource permissions, and OAuth through GitHub and Google keeps teams operating within defined boundaries. A full OpenAPI specification, dedicated CLI, and typesafe client libraries for Rust and TypeScript make programmatic integration straightforward. With 12,000+ stars and active development, the community continues expanding multi-architecture builds and Swarm tooling.
Conductor
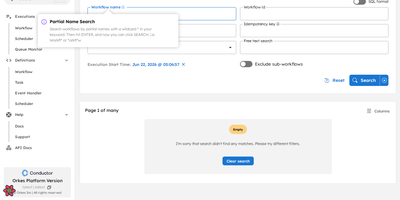
Originally built at Netflix to orchestrate microservices powering 230 million subscribers and now trusted in production at Tesla, LinkedIn, and J.P. Morgan, Conductor is the most battle-tested open-source workflow engine available — with 32,000 GitHub stars and horizontal scalability to billions of executions. The architecture cleanly separates orchestration from business logic: workflows are defined in declarative JSON while workers execute tasks in any of seven supported languages (Java, Python, Go, JavaScript, C#, Ruby, Rust) with zero framework constraints. Durable execution persists every state transition, enabling automatic retries, configurable timeouts, crash recovery, and instant replay from any failure point without re-executing completed tasks. Native AI agent orchestration supports 14+ LLM providers (Anthropic, OpenAI, Google Gemini, AWS Bedrock, Mistral, Cohere, HuggingFace, Ollama), MCP tool calling, function calling, human-in-the-loop approval gates, and vector database integration (Pinecone, pgvector, MongoDB Atlas) for RAG pipelines. Deploy with your choice of five persistence backends (PostgreSQL, Redis, MySQL, Cassandra, SQLite), six message brokers, and Elasticsearch or OpenSearch for workflow indexing — all configurable via Docker Compose files included in the repository. The built-in web UI provides workflow visualization, execution monitoring, task queue inspection, and manual intervention controls. Running on a dedicated VPS on RepoCloud with guaranteed CPU, RAM, and SSD, full root SSH access, and a browser serial console. Apache-2.0 licensed.
CrowdSec Web UI
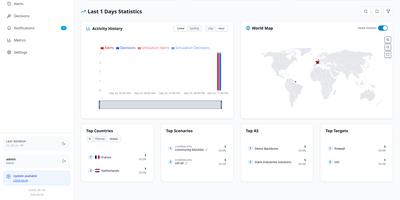
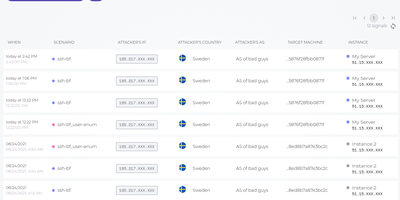
CrowdSec Web UI provides a centralized web console for monitoring intrusion detection telemetry, managing firewall remediation decisions, and auditing security events across multiple CrowdSec security engines. Administrators can connect several CrowdSec Local API endpoints simultaneously, aggregating threat intelligence and active bans into a unified visual interface. The dashboard displays geographic origins of attacking IP addresses, active remediation durations, and specific scenario triggers such as brute-force authentication attacks or web vulnerability probes. Operators can search through historical alert logs, inspect raw HTTP request details, and drill down into individual IP behaviors to differentiate authentic threats from false positives. Manual intervention tools let security teams enforce custom IP bans, adjust expiration timers, or immediately revoke erroneous bans across all connected bouncers with a single click. Integrated notification pipelines dispatch real-time security alerts to external destinations including ntfy, Gotify, and MQTT message brokers whenever critical thresholds are breached. Built-in Prometheus metrics dashboards visualize processing latencies, parser throughput, and decision counts over customizable time windows. Running on a dedicated VPS on RepoCloud with guaranteed CPU, RAM, and SSD, full root SSH access, and a browser serial console. AGPL-3.0 licensed.
SonarQube Community
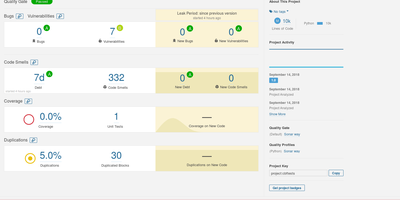
Trusted by over seven million developers worldwide with 310+ contributors and more than 10,600 GitHub stars since 2011, SonarQube has become the industry standard for automated code review and continuous code quality inspection. The platform performs deep static analysis across Java, JavaScript, TypeScript, Python, C#, C++, PHP, Kotlin, Go, Ruby, Swift, and 30+ additional languages, detecting bugs that cause runtime failures, security vulnerabilities exploitable by attackers, security hotspots requiring manual review, code smells degrading maintainability, and code duplications increasing technical debt. Quality Gates define pass-fail thresholds on metrics like coverage, duplications, reliability rating, and security rating, failing CI/CD pipelines when new code introduces issues below organizational standards. Pull request analysis decorates GitHub, GitLab, Bitbucket, and Azure DevOps merge requests with inline issue annotations and overall quality summaries before merging. Built-in quality profiles provide curated rule sets per language following the Sonar Way methodology, with dedicated profiles for AI-generated code that target patterns commonly introduced by agentic coding workflows. Infrastructure-as-Code analysis covers Terraform, Kubernetes, Docker, Ansible, CloudFormation, and Helm charts with supply-chain security rules for CI/CD pipelines. The companion IDE plugin delivers real-time analysis with quick-fix guidance directly in VS Code, IntelliJ, and Eclipse. Running on a dedicated VPS on RepoCloud with guaranteed CPU, RAM, and SSD, full root SSH access, and a browser serial console. LGPL-3.0 licensed.
Gitea
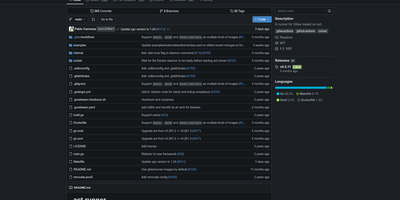
With over 57,000 GitHub stars and deployment across thousands of organizations worldwide, Gitea is the most popular self-hosted Git service, delivering a complete software development platform in a single Go binary that runs on as little as 512MB of RAM. The platform provides full repository management with pull requests featuring inline code review, branch protection rules, merge strategies including squash, rebase, and merge commit, and automated status checks through Gitea Actions. The built-in CI/CD system uses the same YAML workflow syntax as GitHub Actions and can directly reuse over 20,000 existing Actions plugins, allowing teams to migrate from GitHub with minimal pipeline rewrites using the open-source act_runner executor. The integrated package registry supports over 20 formats including npm, PyPI, Maven, NuGet, Cargo, Helm, Composer, Conda, RubyGems, Pub, and an OCI-compatible Container registry for Docker images with no additional configuration required. Project management features include issue tracking with labels, milestones, dependencies, and time tracking, alongside kanban project boards for visual workflow management. Gitea supports LFS for large file storage, built-in wiki pages per repository, webhook integrations with Slack, Discord, Telegram, Microsoft Teams, and custom HTTP endpoints, and OAuth2 authentication with LDAP, SAML, and PAM backend support. Repository mirroring enables bidirectional synchronization with GitHub, GitLab, and Bitbucket, while the comprehensive REST and GraphQL APIs power external integrations and the official tea CLI tool. Running on a dedicated VPS on RepoCloud with guaranteed CPU, RAM, and SSD, full root SSH access, and a browser serial console. MIT licensed.
CrowdSec
With over 14,000 GitHub stars and a growing global network of security deployments, CrowdSec turns every attack on any participating server into protection for the entire community. The security engine operates as a combined IDS/IPS and WAF, analyzing log sources from Nginx, Apache, SSH, WordPress, and over 50 other services to detect brute force attacks, port scans, web vulnerability exploitation, and credential stuffing in real time. When one server detects a new threat, the attacker's IP is shared through the community blocklist, proactively protecting thousands of other installations before the attacker can reach them. The built-in WAF powered by Coraza v3 inspects HTTP requests at the application layer, validates against OpenAPI schemas, and applies custom rules with flexible AND/OR condition mixing for precise threat detection. Bot detection serves challenge pages with client fingerprinting to distinguish legitimate traffic from automated scrapers and scanners. Remediation components block malicious IPs at multiple infrastructure layers including iptables, nftables, Nginx, HAProxy, Cloudflare, and AWS Security Groups through the detect-here-remedy-there architecture. The scenario-based detection system ships with default rules for common attack patterns and supports custom scenarios written in YAML with an expressive filter language. A centralized console provides real-time visualization of alerts, threat intelligence analysis, and management of multiple distributed security engines. GDPR compliant by design, all log analysis happens locally and raw logs never leave your infrastructure. Running on a dedicated VPS on RepoCloud with guaranteed CPU, RAM, and SSD, full root SSH access, and a browser serial console. MIT licensed.
OpenObserve
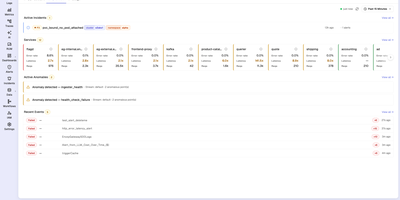
With 20,500+ GitHub stars and over 6,000 organizations running it in production — including a Fortune 100 company ingesting more than 4 PB per day — OpenObserve is the open-source observability platform that replaces your entire Datadog, Splunk, or ELK stack with a single Rust binary deploying in under two minutes. Apache Parquet columnar storage with zstd compression on S3-compatible object storage delivers 140x lower storage costs than Elasticsearch while providing better query performance on a quarter of the hardware. Ingest logs, metrics, and distributed traces via native OpenTelemetry OTLP endpoints with no vendor lock-in. Query logs and traces with standard SQL, metrics with SQL or PromQL — no proprietary query language to learn. The built-in dashboard builder offers 19 chart types including time-series graphs, heatmaps, gauges, tables, and top-K lists with drag-and-drop layout combining data from all signal types. Data pipelines process, enrich, redact, or normalize ingestion streams using Vector Remap Language for real-time transformations including PII redaction and logs-to-metrics conversion. Real User Monitoring captures frontend performance with session replay. The Service Catalog provides topology-based trace analysis with side-panel drill-downs into database queries and error details. Alerting supports real-time and scheduled rules with SQL and PromQL conditions. Native multi-tenancy isolates organizations and streams with complete data separation. Running on a dedicated VPS on RepoCloud with guaranteed CPU, RAM, and SSD, full root SSH access, and a browser serial console. AGPLv3 licensed.
AnythingMCP
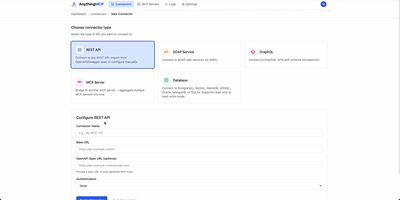
Connecting autonomous AI assistants to internal enterprise databases and legacy systems is streamlined by AnythingMCP, a visual Model Context Protocol gateway with automated knowledge graph generation and granular access controls. Engineers can import OpenAPI specifications, Postman collections, SOAP WSDL files, or raw database credentials to generate standardized Model Context Protocol tools in minutes without writing custom code. The built-in knowledge graph automatically maps entity relationships across disparate databases and software platforms, teaching agents how to correlate customer records in CRM tools with live order histories in enterprise resource planning software. System administrators can enforce fine-grained access policies by restricting tool execution permissions to specific roles and scoping database operations to read-only queries with strict row limits. An interactive web console provides real-time tool inspection, payload testing, request tracing, and comprehensive audit logs that capture every upstream invocation with full parameter visibility. Enterprise teams can integrate identity providers through OAuth2, SAML single sign-on, and SCIM automated user provisioning while protecting sensitive credentials using AES-256-GCM encryption at rest. Running on a dedicated VPS on RepoCloud with guaranteed CPU, RAM, and SSD, full root SSH access, and a browser serial console. GNU AGPLv3 licensed.
xyOps
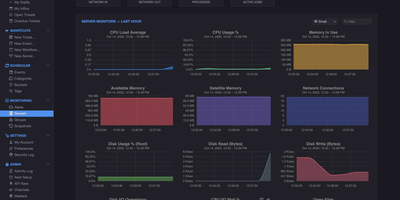
With 4,500+ GitHub stars and version 1.0.92 released August 2026, xyOps delivers a complete operations platform that unifies workflow automation, job scheduling, server monitoring, alerting, and incident response in one self-hosted system. The platform uses a distributed architecture where a central conductor coordinates lightweight xySat satellite agents running on Linux, macOS, or Windows worker nodes via persistent WebSocket connections. The visual workflow builder lets you chain events, triggers, actions, and monitors into multi-step pipelines with conditional logic, fan-out/fan-in parallelism, multiplex controllers for fleet-wide execution, and configurable resource limits. QuickMon provides per-second CPU, memory, disk, and network visibility streamed live to the web UI, while user-defined monitor plugins sample metrics every minute with time-series storage at hourly, daily, monthly, and yearly resolutions. Alert triggers evaluate expressions against live data and fire notifications via email, webhook, or custom actions, with full server snapshots attached showing every running process, network connection, and resource utilization at the moment of detection. Failed jobs and alerts automatically create tickets with linked logs, metrics history, and context for end-to-end incident tracking. The plugin marketplace supports extensions written in any language, and the Docker plugin enables container-based job execution. Deploy via Docker with persistent volumes on port 5522 for the web UI and 5523 for API access, running on a dedicated VPS on RepoCloud with guaranteed CPU, RAM, and SSD, full root SSH access, and a browser serial console. BSD-3-Clause licensed.
HashiCorp Vault
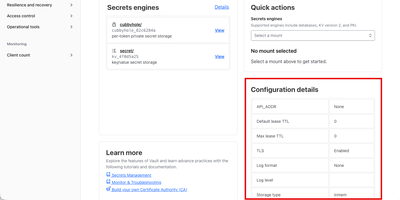
With over 36,000 GitHub stars and adoption by organizations including Adobe, Shopify, and Roblox, HashiCorp Vault is the industry-standard platform for secrets management, encryption services, and privileged access control across hybrid and multi-cloud infrastructure. The key/value secrets engine stores arbitrary secrets with full versioning, soft-delete, and metadata tracking, while dynamic secrets engines generate on-demand, short-lived credentials for AWS, Azure, GCP, databases including PostgreSQL, MySQL, MongoDB, and MSSQL, and SSH access with automatic revocation after configurable lease periods. The PKI secrets engine dynamically issues X.509 certificates on demand with automatic rotation and ACME protocol support, eliminating manual certificate management workflows entirely. Encryption as a service through the transit secrets engine lets applications encrypt, decrypt, sign, verify, and generate HMACs without managing cryptographic keys directly, supporting AES-GCM-256, ChaCha20-Poly1305, RSA-2048/4096, ECDSA-P256/P384, and ED25519 algorithms. Authentication integrates with LDAP, OIDC/OAuth2, SAML, AppRole for machine-to-machine access, Kubernetes service accounts, AWS IAM, Azure Active Directory, and GitHub tokens. Fine-grained ACL policies use path-based rules with glob patterns and sentinel policies for programmatic enforcement. The integrated Raft storage backend provides high-availability clustering without external dependencies, while alternative backends include Consul, S3, DynamoDB, PostgreSQL, and MySQL. The built-in web UI provides a visual interface for browsing secrets, managing policies, configuring auth methods, and monitoring cluster health. Running on a dedicated VPS on RepoCloud with guaranteed CPU, RAM, and SSD, full root SSH access, and a browser serial console. BSL 1.1 licensed.
Pulse
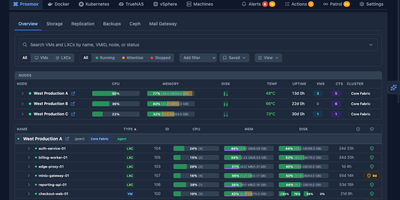
Pulse monitors your entire heterogeneous infrastructure from one screen: Proxmox VE, Proxmox Backup Server, Proxmox Mail Gateway, Docker, Podman, Docker Swarm, Kubernetes, TrueNAS SCALE/CORE, VMware vSphere, and standalone Linux/Windows/macOS machines. The Go binary embeds a SolidJS/TypeScript frontend, delivering WebSocket-driven dashboards with sub-second metric updates on port 7655. A unified agent auto-detects Docker, Podman, Kubernetes, and Proxmox on each host without manual configuration and self-updates silently, while Proxmox nodes need only API credentials with zero agent installation. Smart alerts use adaptive hysteresis-based thresholds to prevent notification floods, pushing to Discord, Slack, Telegram, Teams, email, ntfy.sh, Gotify, and generic webhooks with per-resource overrides. The standout feature is Pulse Patrol: scheduled AI health checks running every ten minutes to seven days using OpenAI, Anthropic, Gemini, or local Ollama models. Patrol catches silent backup failures, capacity creep, restart loops, unhealthy containers, and clock drift that dashboards miss when nobody is watching. Platform-specific views render Proxmox nodes, Ceph clusters, Docker Compose projects, Kubernetes workloads, TrueNAS pools, and vSphere VMs in familiar layouts. OIDC, SSO, and SAML authentication with credential encryption at rest secures access. 6,500+ stars and 441 releases since February 2025. Running on a dedicated VPS on RepoCloud with guaranteed CPU, RAM, and SSD, full root SSH access, and a browser serial console. MIT licensed.
Apprise-API
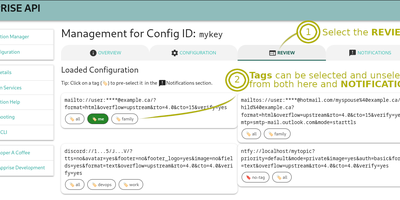
One REST call, 130+ notification services: Apprise API wraps the well-known Apprise library in a lightweight Django/Gunicorn microservice, so "send an alert" works the same whether it goes to Slack, Discord, Telegram, Teams, email, SMS, Pushover, or PagerDuty - each addressed by a simple URL scheme. It solves the credential-sprawl problem cleanly: instead of embedding provider tokens in every app, cron job, and CI pipeline, you centralize them here and everything else just POSTs a body and title. Two modes cover every workflow. Stateless calls to /notify carry target URLs in the payload (or fall back to a default set via APPRISE_STATELESS_URLS); stateful mode stores named configurations server-side under keys, so /notify/{KEY} fans out to everything registered - with tag-based routing (comma for OR, space for AND) selecting which endpoints fire per message. Messages take info, success, warning, or failure types in text, Markdown, or HTML, with attachments up to a configurable size. A built-in web UI manages and tests configurations, APPRISE_CONFIG_LOCK makes the store read-only, service allow/deny lists restrict which schemes work, webhook remapping adapts third-party payloads, and a Prometheus /metrics endpoint watches the gateway itself.
Yep Anywhere
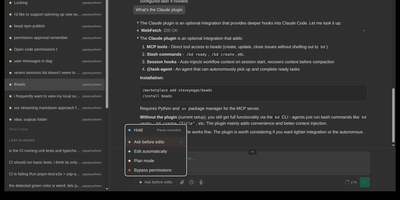
Designed for developers on the go, Yep Anywhere turns any smartphone browser into a full-featured control center for supervising, steering, and reviewing autonomous AI coding agents. Operators can monitor live execution across multiple active projects simultaneously without sitting at a desktop terminal. Real-time reasoning feeds. Instant push alerts for permission prompts. One-tap tool approvals. Developers can unblock pending tasks mid-turn, redirect active workflows, or queue sequential follow-up prompts for automatic delivery at the next safe milestone. An integrated source control viewer displays syntax-highlighted working-tree and commit diffs, allowing reviewers to attach line-level comment bundles directly back into the agent context. Mobile voice transcription lets users dictate instructions straight into running sessions, while photo library integration makes uploading bug screenshots effortless. All agent credentials, CLI configurations, and repository data remain private on the host server without requiring third-party cloud database accounts or proprietary device pairing. Running on a dedicated VPS on RepoCloud with guaranteed CPU, RAM, and SSD, full root SSH access, and a browser serial console. MIT licensed.
HashiCorp Consul
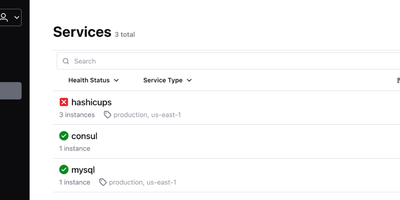
With nearly 30,000 GitHub stars and deployment across organizations including Criteo, Pandora, and Barclays, HashiCorp Consul is the industry-standard platform for service discovery, service mesh, and distributed configuration across dynamic multi-cloud and multi-datacenter infrastructure. Services register themselves and become discoverable via a built-in DNS interface on port 8600 or an HTTP API on port 8500, with health checks ensuring only healthy instances receive traffic through automatic catalog deregistration and service-level circuit breaking. The service mesh capabilities use Envoy sidecar proxies with Transparent Proxy mode to establish automatic mTLS encryption for all service-to-service communication, while identity-based intentions define fine-grained authorization rules controlling which services can communicate. The integrated API Gateway manages north-south traffic into the mesh with configurable routing rules, TLS termination, and header-based matching policies. Consul's distributed key-value store provides hierarchical configuration storage accessible via CLI, HTTP API, and the built-in web UI, with blocking queries enabling watch-based configuration updates without polling. Multi-datacenter federation connects Consul clusters across regions through WAN gossip and RPC forwarding, enabling cross-datacenter service discovery and failover with configurable prepared queries. The Raft consensus protocol provides strong consistency for the service catalog and KV store, with anti-entropy mechanisms ensuring agent state converges with the server catalog. Consul integrates natively with Kubernetes via Helm charts with automatic sidecar injection, Nomad for workload orchestration, Vault for secrets management, and Terraform for infrastructure provisioning. Running on a dedicated VPS on RepoCloud with guaranteed CPU, RAM, and SSD, full root SSH access, and a browser serial console. BUSL 1.1 licensed.