Mularr
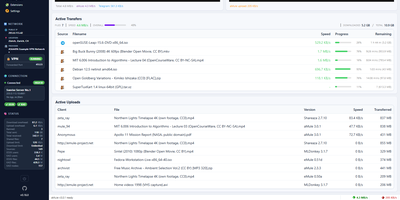
Classic eD2k and Kad downloading gets a browser interface with the look of Windows XP, Windows Classic, a clean modern dashboard, or green-on-black Hacker mode. Mularr wraps an aMule daemon and shows live download and upload graphs, active transfers with progress and remaining time, and the uploads other clients are pulling. Transfers can be started, paused, stopped, categorized, and bulk imported from ED2K links. Servers, search, shared files, categories, and extensions each get their own page. For automation it presents itself as a qBittorrent download client and a Torznab indexer, so Sonarr and Radarr can use it with their standard settings. Extensions for Sonarr and Radarr read the Wanted list and publish matches into a feed the apps can poll. Telegram can act as an extra download provider and notification channel, and Hispashare releases appear in search results next to aMule's. A VPN panel reports Gluetun health and the forwarded port, and the settings page covers ports, bandwidth limits, IP filters, a blacklist, and shared folders. One container image and a single data volume are enough to get started. Running on a dedicated VPS on RepoCloud with guaranteed CPU, RAM, and SSD, full root SSH access, and a browser serial console. MIT licensed.
CLIProxyAPI Dashboard
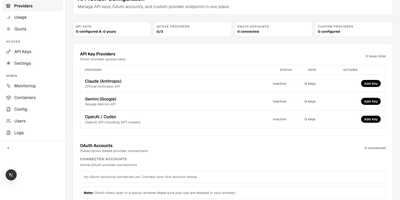
CLIProxyAPI Dashboard puts a web console in front of CLIProxyAPI so you manage AI providers, keys, quotas, and containers through forms instead of YAML files. Connect Claude Code, Codex, xAI, Antigravity, Kimi, and Devin accounts with OAuth, then add Gemini CLI, GitHub Copilot, Kiro, and Cursor through plugins you install and configure from the settings store. Any OpenAI-compatible endpoint can join as a custom provider with model mappings, and admins can mark a provider as shared so the whole team uses it. You create, revoke, and track API keys with per-user ownership, manage dashboard users and admin rights, and stream live logs beside container health. Quota views track rate limits per provider and per model, and Telegram alerts fire when remaining quota drops below your threshold. Usage analytics break down request counts, provider share, model statistics, error rates, and estimated cost. Configuration syncs to OpenCode automatically, model configurations travel as share codes, and backups can be created, scheduled, previewed, and restored from settings. One-click updates refresh the dashboard and proxy images, containers start and stop from the panel, and automatic TLS keeps the console reachable under your domain. Running on a dedicated VPS on RepoCloud with guaranteed CPU, RAM, and SSD, full root SSH access, and a browser serial console. MIT licensed.

TeslaLogger
TeslaLogger records everything your Tesla or Lucid Air does and stores it on hardware in your own home, building a private history no subscription service controls. Trips are logged with consumption and efficiency, charging sessions capture curves and history, and battery degradation and capacity are tracked over years of ownership. Grafana dashboards visualize consumption, trips, charging statistics, and battery health, and the admin panel's own dashboard can be customized for a quick glance. Public fleet statistics compare your degradation and charging curves against other owners, alongside firmware tracking and a map of fast charging sessions. Custom points of interest label the places your car visits, geofencing data organizes trips by location, and Supercharger invoices download automatically into a local folder. Existing histories import from TeslaFi or TeslaMate, so switching loggers does not erase years of records. A route planner link shares data with A Better Route Planner without handing your account to a third party or keeping the car awake. Eleven interface languages cover most households, and the same software runs in Docker, on a Synology NAS, or on a small Raspberry Pi beside the router, quietly logging through the official Fleet API permissions. Running on a dedicated VPS on RepoCloud with guaranteed CPU, RAM, and SSD, full root SSH access, and a browser serial console. GPL 3.0 licensed.

LobsterBoard
LobsterBoard lets you assemble custom monitoring dashboards from 50 pre-built widgets using a visual drag-and-drop editor, covering everything from CPU and memory gauges to AI subscription trackers, stock tickers, and camera feeds on your own server with zero cloud dependencies. The snap-grid editor handles layout composition with resize handles and a property panel, so you drag widgets onto a canvas, configure their data sources, and the dashboard is live. Real-time system statistics flow through Server-Sent Events, updating CPU load, memory pressure, disk usage, network throughput, and Docker container status without page refreshes. Five built-in themes range from a dark default to a retro CRT terminal aesthetic, a warm sepia paper look, and pastel options for different display environments. The template gallery lets you export complete dashboard layouts with auto-captured screenshot previews, share them with other users, and import configurations as a full replacement or selective merge. Custom pages extend beyond dashboards into notes, kanban boards, or any free-form layout you need. Built-in widgets connect to iCal feeds for calendar events, RSS sources for news aggregation, weather APIs for local conditions, and financial data providers for cryptocurrency and stock prices. The whole system runs from a single server.cjs file with zero cloud dependencies or external frameworks. Running on a dedicated VPS on RepoCloud with guaranteed CPU, RAM, and SSD, full root SSH access, and a browser serial console. BSL-1.1 licensed (free for non-commercial use; converts to MIT in 2030).
dinkydash
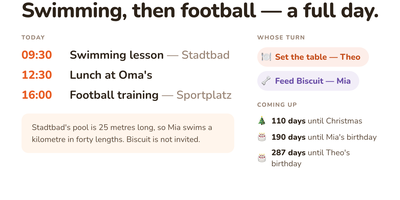
The family calendar nobody opens helps nobody, so DinkyDash puts it on a screen the household walks past. Paste in iCal links from Google, iCloud and Outlook calendars and the board merges them into one agenda in time order, big enough to read from across the kitchen, with tomorrow tucked underneath when the day leaves room. A personal calendar can share only the events marked for a partner and keep work and private appointments to itself. Chores answer the daily argument on their own: whose turn it is moves on with the date, so nobody ticks anything off. Birthdays, holidays and special dates count down in the corner, and once a day the board gets a fresh headline written about your actual day, with a useful note parked under the agenda. Light and dark themes come from the settings page, and that same settings page on your phone edits the configuration file directly, comments preserved. A preview page shows the board at Pi, TV and tablet sizes side by side before you mount anything. There is deliberately no login: it assumes your home network, rewards you with a board you never sign into, and asks to stay behind a VPN or an authenticated proxy if you view it away from home. Running on a dedicated VPS on RepoCloud with guaranteed CPU, RAM, and SSD, full root SSH access, and a browser serial console. MIT licensed.
Briefer
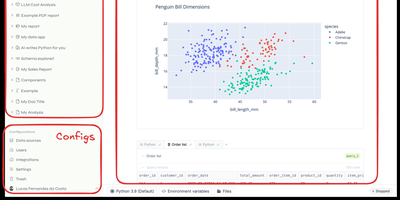
Backed by Y Combinator with 4,300 GitHub stars and growing rapidly since its September 2024 launch, Briefer delivers the first truly unified notebook-and-dashboard platform that eliminates the fragmented workflow of juggling Jupyter for analysis, Tableau for visualization, and Notion for documentation — combining all three in a single Notion-like workspace where SQL query results automatically become Python DataFrames accessible in subsequent code blocks. The built-in AI analyst understands your database schema and notebook context to generate SQL queries, write Python transformations, create visualizations, and fix errors on demand using configurable OpenAI or private LLM backends. Connect directly to PostgreSQL, MySQL, BigQuery, Redshift, Snowflake, and Amazon Athena as data sources, or upload CSV files for immediate analysis. Native point-and-click visualizations produce charts, tables, and dashboards without writing code, while interactive data apps use inputs, dropdowns, and date pickers to create parameterized reports for non-technical stakeholders. Scheduled execution runs notebooks and dashboards periodically with results delivered via Slack integration or public shareable links. Write-back queries modify production data directly from notebooks for ad-hoc pipeline testing. The architecture runs as three Docker containers — web frontend, API server, and optional AI service — backed by PostgreSQL and a Jupyter server for Python execution, deployable via single Docker command, Docker Compose, or Helm charts for Kubernetes. Running on a dedicated VPS on RepoCloud with guaranteed CPU, RAM, and SSD, full root SSH access, and a browser serial console. AGPLv3 licensed.
Rath
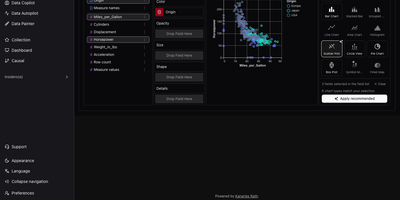
RATH, an automated data exploration workbench, turns any table into a gallery of charts worth reading, without building each chart by hand. Start with a CSV, JSON, or Excel file, or pull tables from MySQL, PostgreSQL, Oracle, SQL Server, SQLite, or Airtable. Eight built-in demo datasets are ready to try. Next comes a profile: every field gets a distribution chart and summary statistics. A metadata view retags fields as dimensions or measures. Data Autopilot then searches the dataset and pages through generated insight charts. Charts can be starred, exported, or opened in the editor. Starting from a single field, Data Copilot lists associated patterns to follow, with controls to add variables, filters, and computations. For hands-on work, the drag-and-drop chart builder offers fifteen chart types, including heat maps, box plots, and maps, plus a button that applies the recommended chart. With Data Painter, you brush points into up to ten labeled color groups or erase anomalies, then search for a chart that explains the painting. Causal analysis runs one of ten discovery algorithms, including PC, FCI, GES, and GRaSP. It then draws a directed graph with influence percentages, plus charts and statistics for any field you select. Dashboards combine titles, text, and charts in movable, resizable cards with four themes and global filters. Running on a dedicated VPS on RepoCloud with guaranteed CPU, RAM, and SSD, full root SSH access, and a browser serial console. AGPL-3.0 licensed.
KoShelf
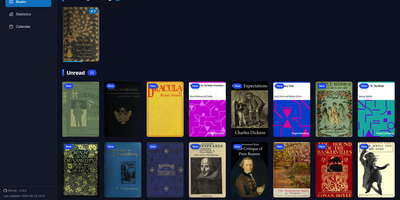
Your e-reader already knows everything about your reading life, and KoShelf turns that KOReader metadata into a beautiful dashboard you can browse from any browser. The library overview gathers currently reading, completed, and unread books and comics, while each item's page collects your highlights, annotations, ratings, and review notes in one place. Reading statistics chart your time and pages with customizable activity heatmaps and weekly breakdowns, and per-item statistics reveal session counts, average session length, and reading speed for every book. A monthly calendar shows what you read on each day, and the yearly recap celebrates completions with monthly summaries of finished items and hours read. Supported books open right inside KoShelf's own reader, with keyboard navigation, a progress scrubber, and inline highlight notes. Metadata entries survive even when the original document disappears, because library archives preserve covers and reading data until the source returns. With writeback enabled in server mode, you can edit annotations, ratings, status, and covers from the browser, protected by revision checks and recoverable backups so external changes are never overwritten blindly. Search by title, author, or series, filter by reading status, and download original files whenever you need them. Running on a dedicated VPS on RepoCloud with guaranteed CPU, RAM, and SSD, full root SSH access, and a browser serial console. EUPL-1.2 licensed.
bullstudio
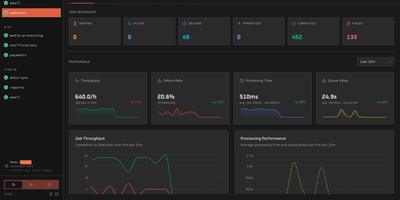
bullstudio turns a pile of opaque Redis keys into a live control panel for your BullMQ and Bull queues, so you can see what is stuck, failing, or delayed without opening a Redis CLI. Point it at a Redis URL and it discovers every queue and prefix on its own, including Redis Cluster setups. The overview page tracks waiting, active, delayed, prioritized, completed, and failed counts next to throughput, failure rate, processing time, and queue delay charts. Open any job to read its input data, logs, return value, and stack trace, then retry, promote, or remove it in one click. Flow view draws parent and child jobs as a color-coded dependency graph, which makes it easy to spot the step where a multi-stage job stalled. Separate screens list connected workers with their concurrency and heartbeat, and show repeatable and cron schedules with their next run time. Pause, resume, drain, or clean a queue directly from the header. Basic authentication, a read-only mode, and a base path for reverse proxies keep access under control. Running on a dedicated VPS on RepoCloud with guaranteed CPU, RAM, and SSD, full root SSH access, and a browser serial console. MIT licensed.
Hiccup
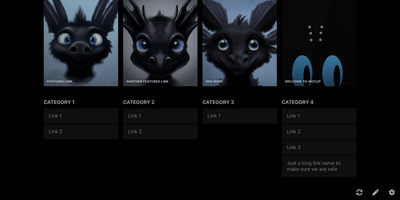
"Get to your most important links, FAST" - Hiccup's README states its whole mission in that one line, and the static start page delivers it. It is a client-side React single-page app - no backend, no database, no accounts - driven entirely by a config.json that defines featured link cards, categorized sections, and search providers. The search bar is the power feature: it queries your own links by name, URL, and tag while simultaneously offering external providers like Google, DuckDuckGo, and Amazon (plus custom URL-template providers you define), with arrow-key navigation and Enter to launch, so muscle memory replaces mousing. Editing happens in the browser - drag and drop links and background images, tweak cards in edit mode - with changes persisting to localStorage; a built-in config manager exports the JSON for hosting, and remote profile loading pulls a shared config across every browser and device you use. Multiple profiles keep home-server, work, and dev-tool link sets separate. PWA support installs it on a phone home screen, caching strategies keep it fast offline, read-only mode suits kiosk displays, and Cmd/Ctrl+/ reveals the full hotkey reference. Serve it from any static host and point your new tab at it.