Middleware
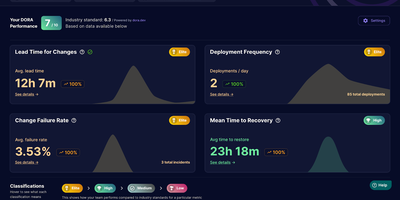
Middleware turns the pull request history your team already has into live DORA metrics, so engineering leads can see deployment frequency, lead time, recovery time, and change failure rate without building a reporting pipeline. Connect GitHub with a personal access token, group repositories into teams, and the dashboard starts charting how often you ship and how long changes take to reach production. Lead time is not one opaque number; it breaks into first commit to pull request, first response time, rework time, merge time, and merge to deploy, so the actual bottleneck is visible instead of guessed at. Merged pull requests count as deployments and revert pull requests count as incidents, which means recovery time and change failure rate appear even if your team has no separate incident tool wired up. You can exclude bot and dependency pull requests, define which branches count as production, and filter incidents in settings, so the metrics match how your team actually ships rather than how a generic template assumes. Bring it to a weekly engineering review to catch a review queue quietly doubling merge times, or open it after an incident to see if failure rate is trending the wrong way across a team. Running on a dedicated VPS on RepoCloud with guaranteed CPU, RAM, and SSD, full root SSH access, and a browser serial console. Apache-2.0 licensed.
Deploy