Depictio
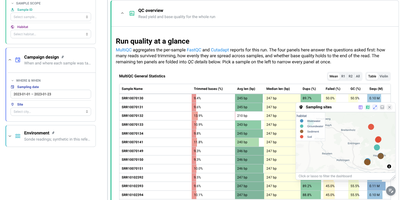
For teams drowning in pipeline output nobody reads, Depictio turns workflow results into dashboards you can hand to a collaborator. A MultiQC tab answers the first questions about a sequencing run: how many reads survived trimming, how evenly they spread across samples, and whether base quality holds to the end of the read, all in one glanceable table. Filter by sample, habitat, site, or sampling date on the left and every panel on the page follows, from community composition cards counting distinct taxa and phyla to differential abundance views that show what was tested, what survives correction, and how large the effects are. Alpha diversity tabs summarise richness and evenness per sample with rarefaction curves, and a sampling sites map lets you click or lasso points to filter the whole dashboard by geography. Forty two ready-made templates cover nf-core pipelines such as ampliseq, atacseq, and airrflow, while outputs from Nextflow, Snakemake, Galaxy, or plain shell scripts feed the same builder. Even a classic tabular dataset becomes an overview of distributions, box plots, and threshold counts, so the same tool serves a wet lab and a data science team. Running on a dedicated VPS on RepoCloud with guaranteed CPU, RAM, and SSD, full root SSH access, and a browser serial console. MIT licensed.
Deploy