EaseProbe
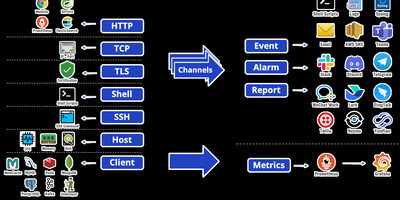
A single binary watches everything you care about and only bothers you when something breaks. EaseProbe is an open-source health and status checker that probes websites over HTTP, TCP ports, ping, TLS certificates, shell commands, SSH hosts, and native clients for MySQL, PostgreSQL, Redis, MongoDB, Kafka, Memcache, and ZooKeeper. Each target gets an interval, timeout, retry checks, and data validation, from HTTP status and XPath evaluation to a Redis key matching an expected value; SSH host probes also watch CPU, memory, and disk so slow saturation gets caught alongside hard failures. When a target flips state, edge-triggered notifications fan out to Slack, Discord, Telegram, Microsoft Teams, email, AWS SNS, WeCom, DingTalk, Lark, SMS providers, log files, syslog, or your own shell script, with repeat alerts and quiet recovery behavior under your control. Availability history accumulates into daily, weekly, or monthly SLA reports delivered through those same channels, plus a live SLA page and JSON endpoint served by the probe itself. Everything it measures also exits as Prometheus metrics with per-target status, latency, and uptime, ready for Grafana dashboards and alerting rules alongside the rest of your stack. Configuration is one YAML file, persistence is one local data file, and the same binary runs on a tiny VPS watching an entire fleet. Running on a dedicated VPS on RepoCloud with guaranteed CPU, RAM, and SSD, full root SSH access, and a browser serial console. Apache-2.0 licensed.
HotHost
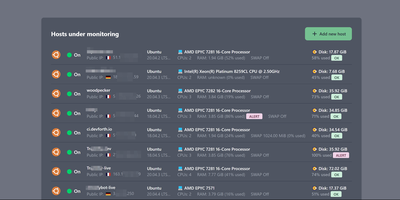
HotHost answers the only two questions that matter about every server you own, is it up and is the disk about to fill, before your users ask them instead. One web container collects metrics from a tiny agent you paste onto each host as a Docker or shell snippet, and the fleet lands in a single table: hostname, public IP, RAM and disk usage, CPU model and cores, swap state, and country. Disk and RAM get loud ALERT badges at a configurable threshold, ninety percent by default, and notifications fire on failure and again on recovery, so a resolved incident closes its own loop. The same console watches your websites directly, requesting each URL on your interval and checking the status code, a required keyword in the response, or basic auth behavior. SSL certificates get an expiration reminder fourteen days out by default, long before the browser warnings start. When memory climbs, the top ten RAM-consuming processes are charted over the last two days, turning "something is eating the box" into a named culprit. Alerts route through Email, Slack, Telegram, or Gmail plugins, and the plugin system accepts your own notifiers. Running on a dedicated VPS on RepoCloud with guaranteed CPU, RAM, and SSD, full root SSH access, and a browser serial console. MIT licensed.
Upstat
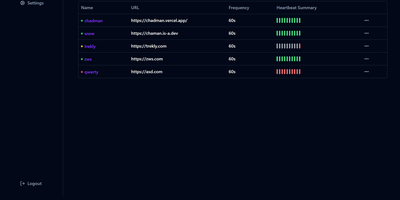
When a service you run goes down at 3 a.m., Upstat is the watcher that notices first and writes it down. Add any HTTP or HTTPS endpoint and it checks in every sixty seconds, building a living record of uptime, response latency, and ping times that you can read at a glance from status and latency charts. Certificate details sit alongside each monitor, so an expiring TLS certificate stops being a surprise outage waiting for a date. Each monitor can appear on public status pages, and you can run several of them, mapping different pages to different domains so customers, clients, or separate products each get their own honest view of what is up. When a check fails, a Discord notification heads to your channel with the news, and the dashboard keeps the incident in its history instead of letting it vanish into a chat scrollback. Install it as a progressive web app, keep its data in SQLite for a one-file setup or PostgreSQL when the deployment grows, and the whole thing stays on infrastructure you control. Running on a dedicated VPS on RepoCloud with guaranteed CPU, RAM, and SSD, full root SSH access, and a browser serial console. MIT licensed.