Stars
Forks
Watchers
Developer links
Upstat
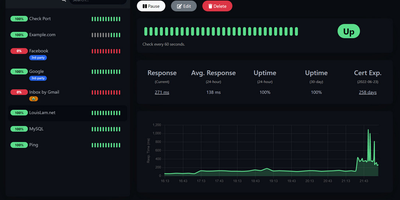
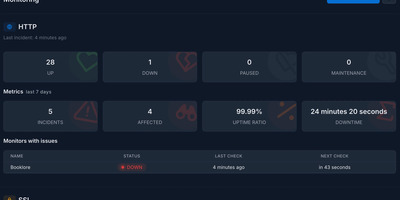
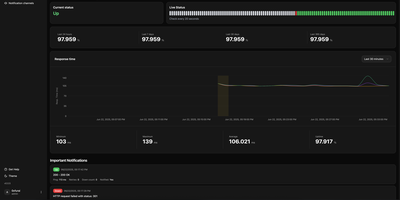
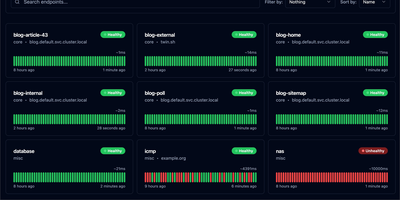
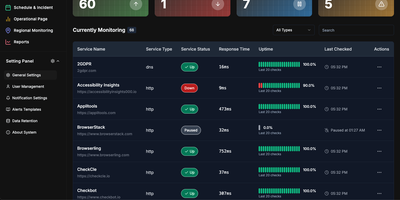
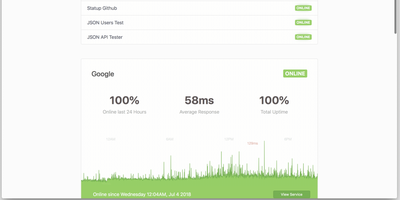
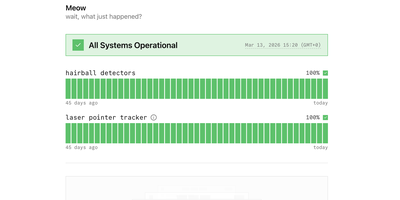
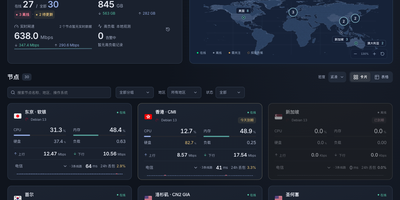
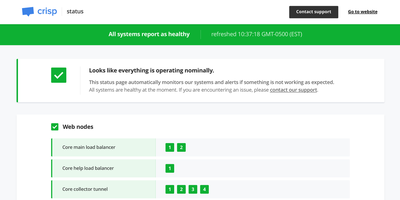
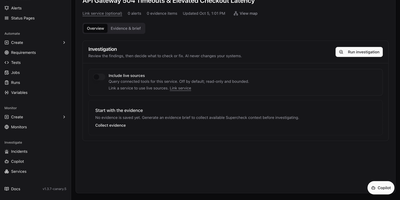
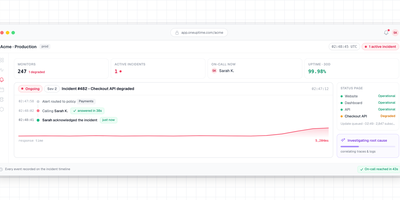
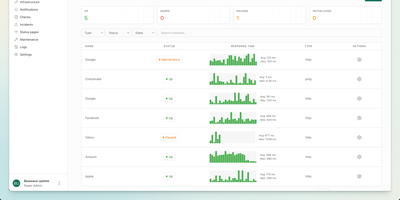
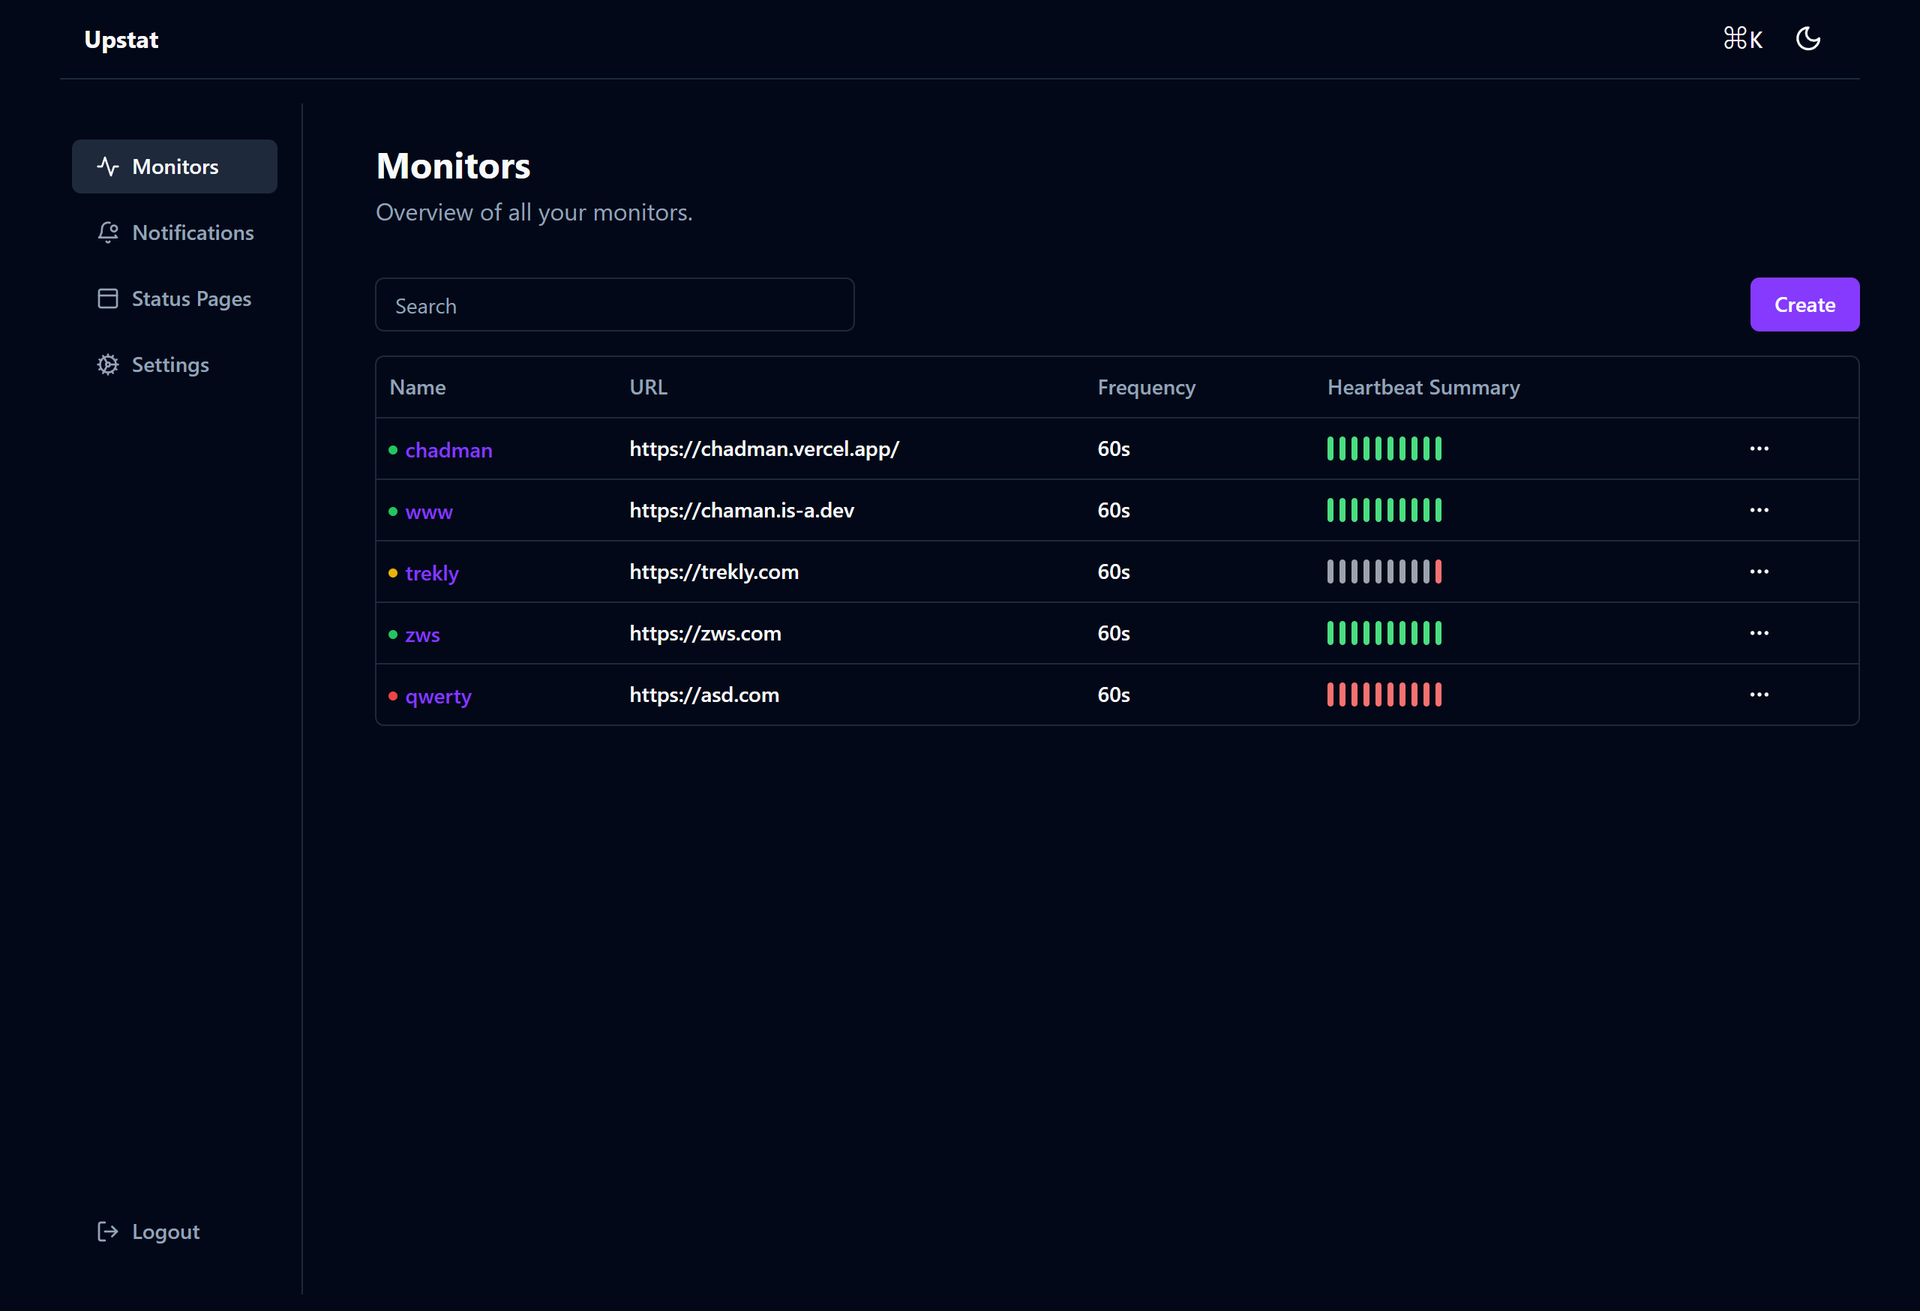
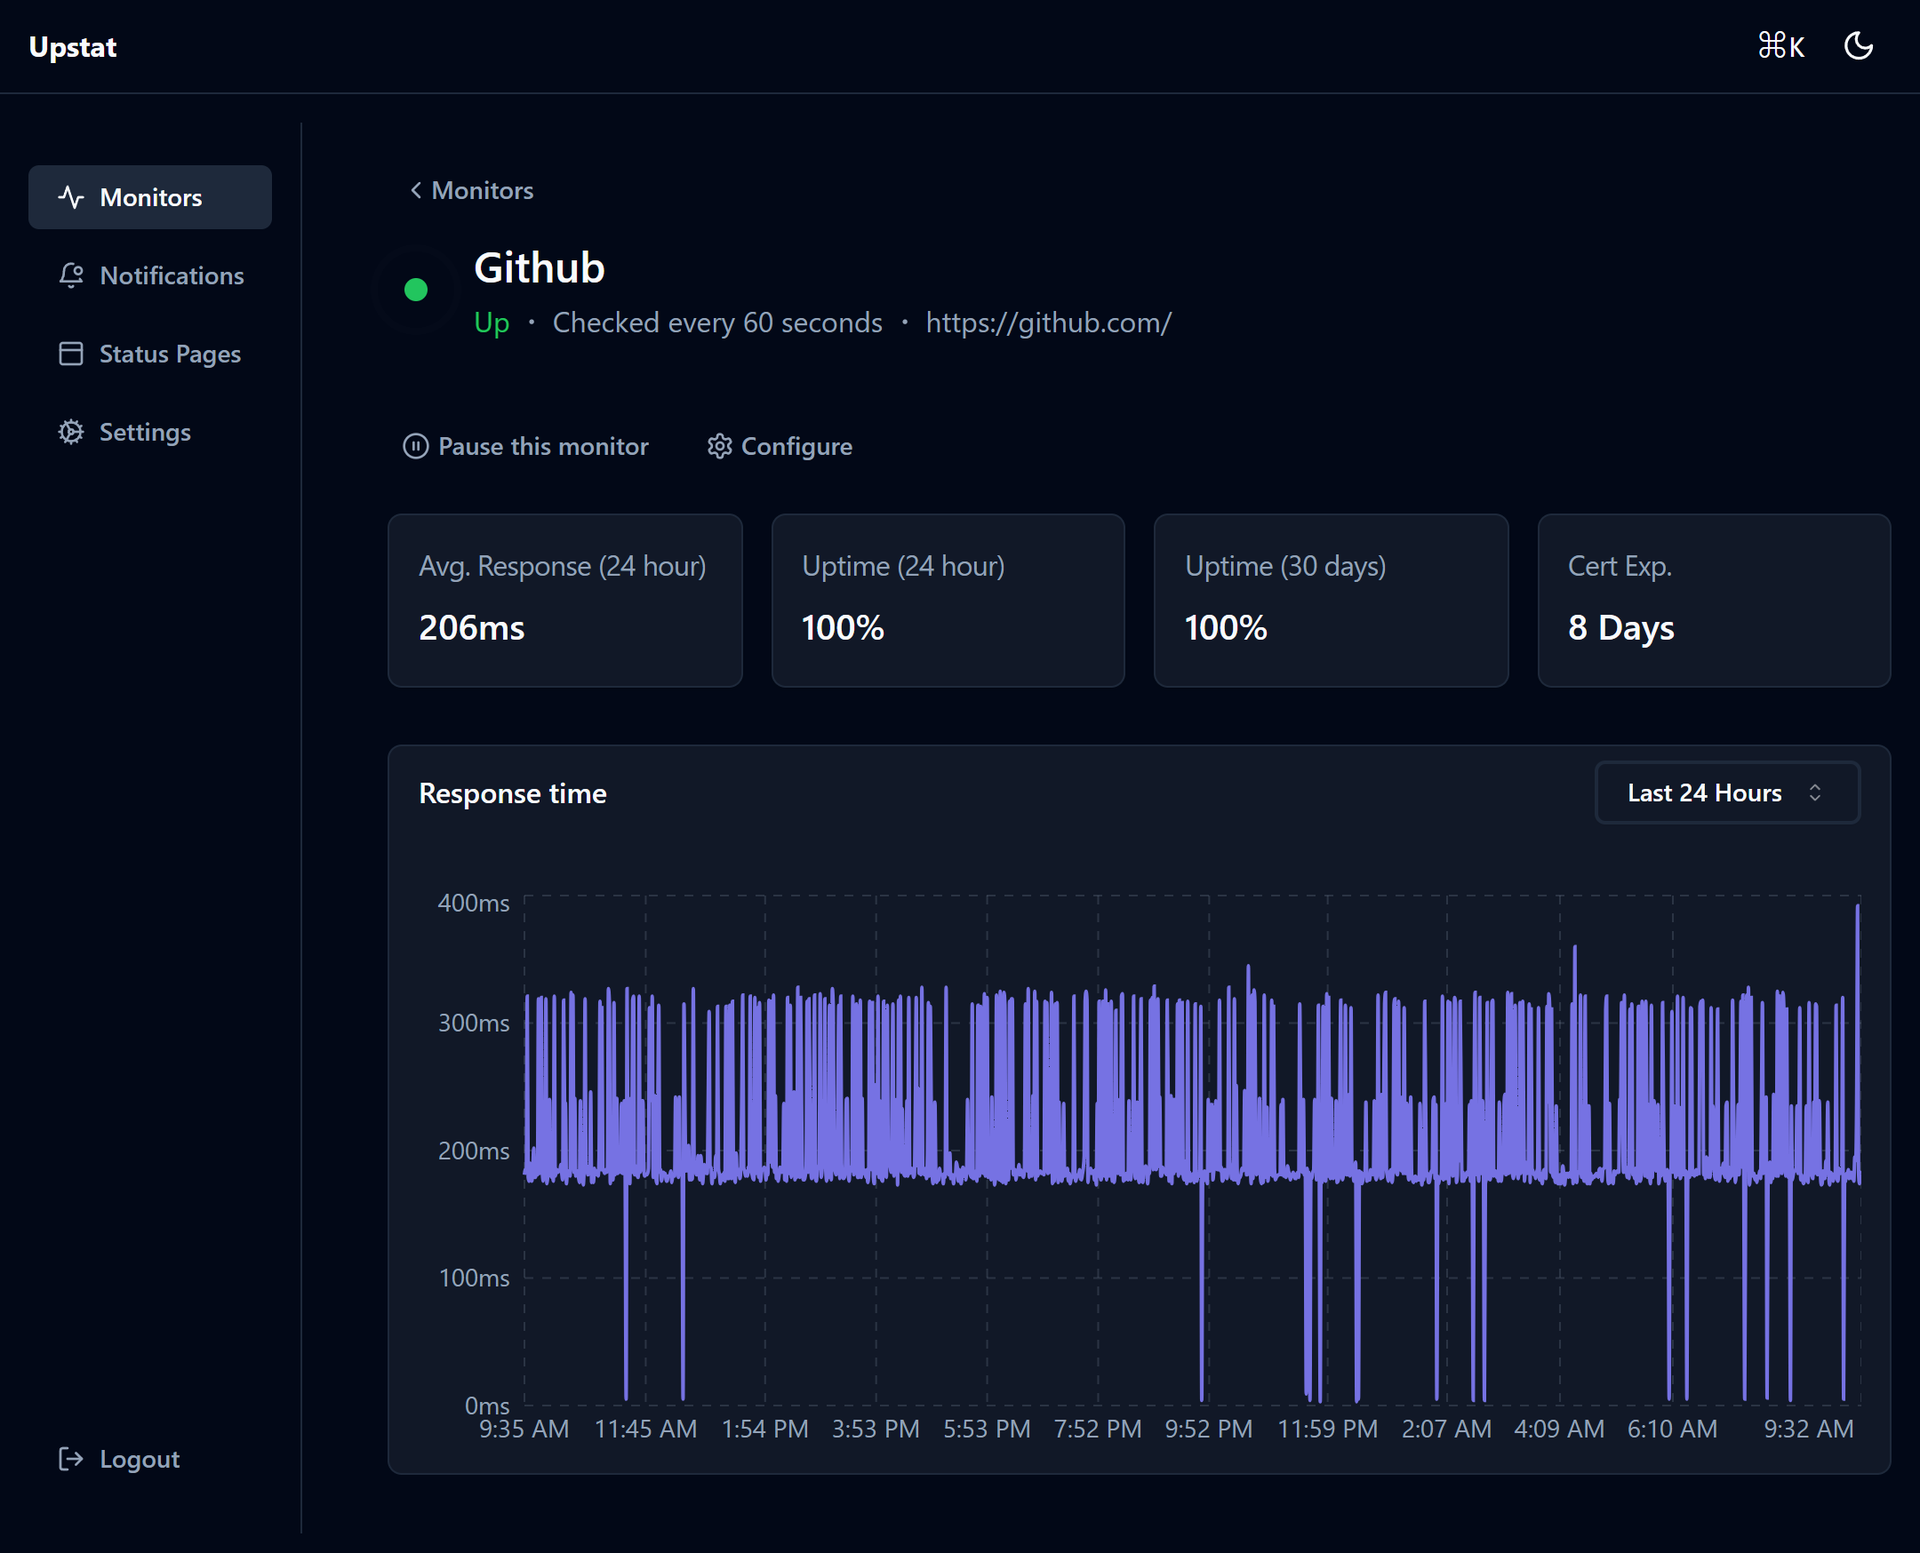
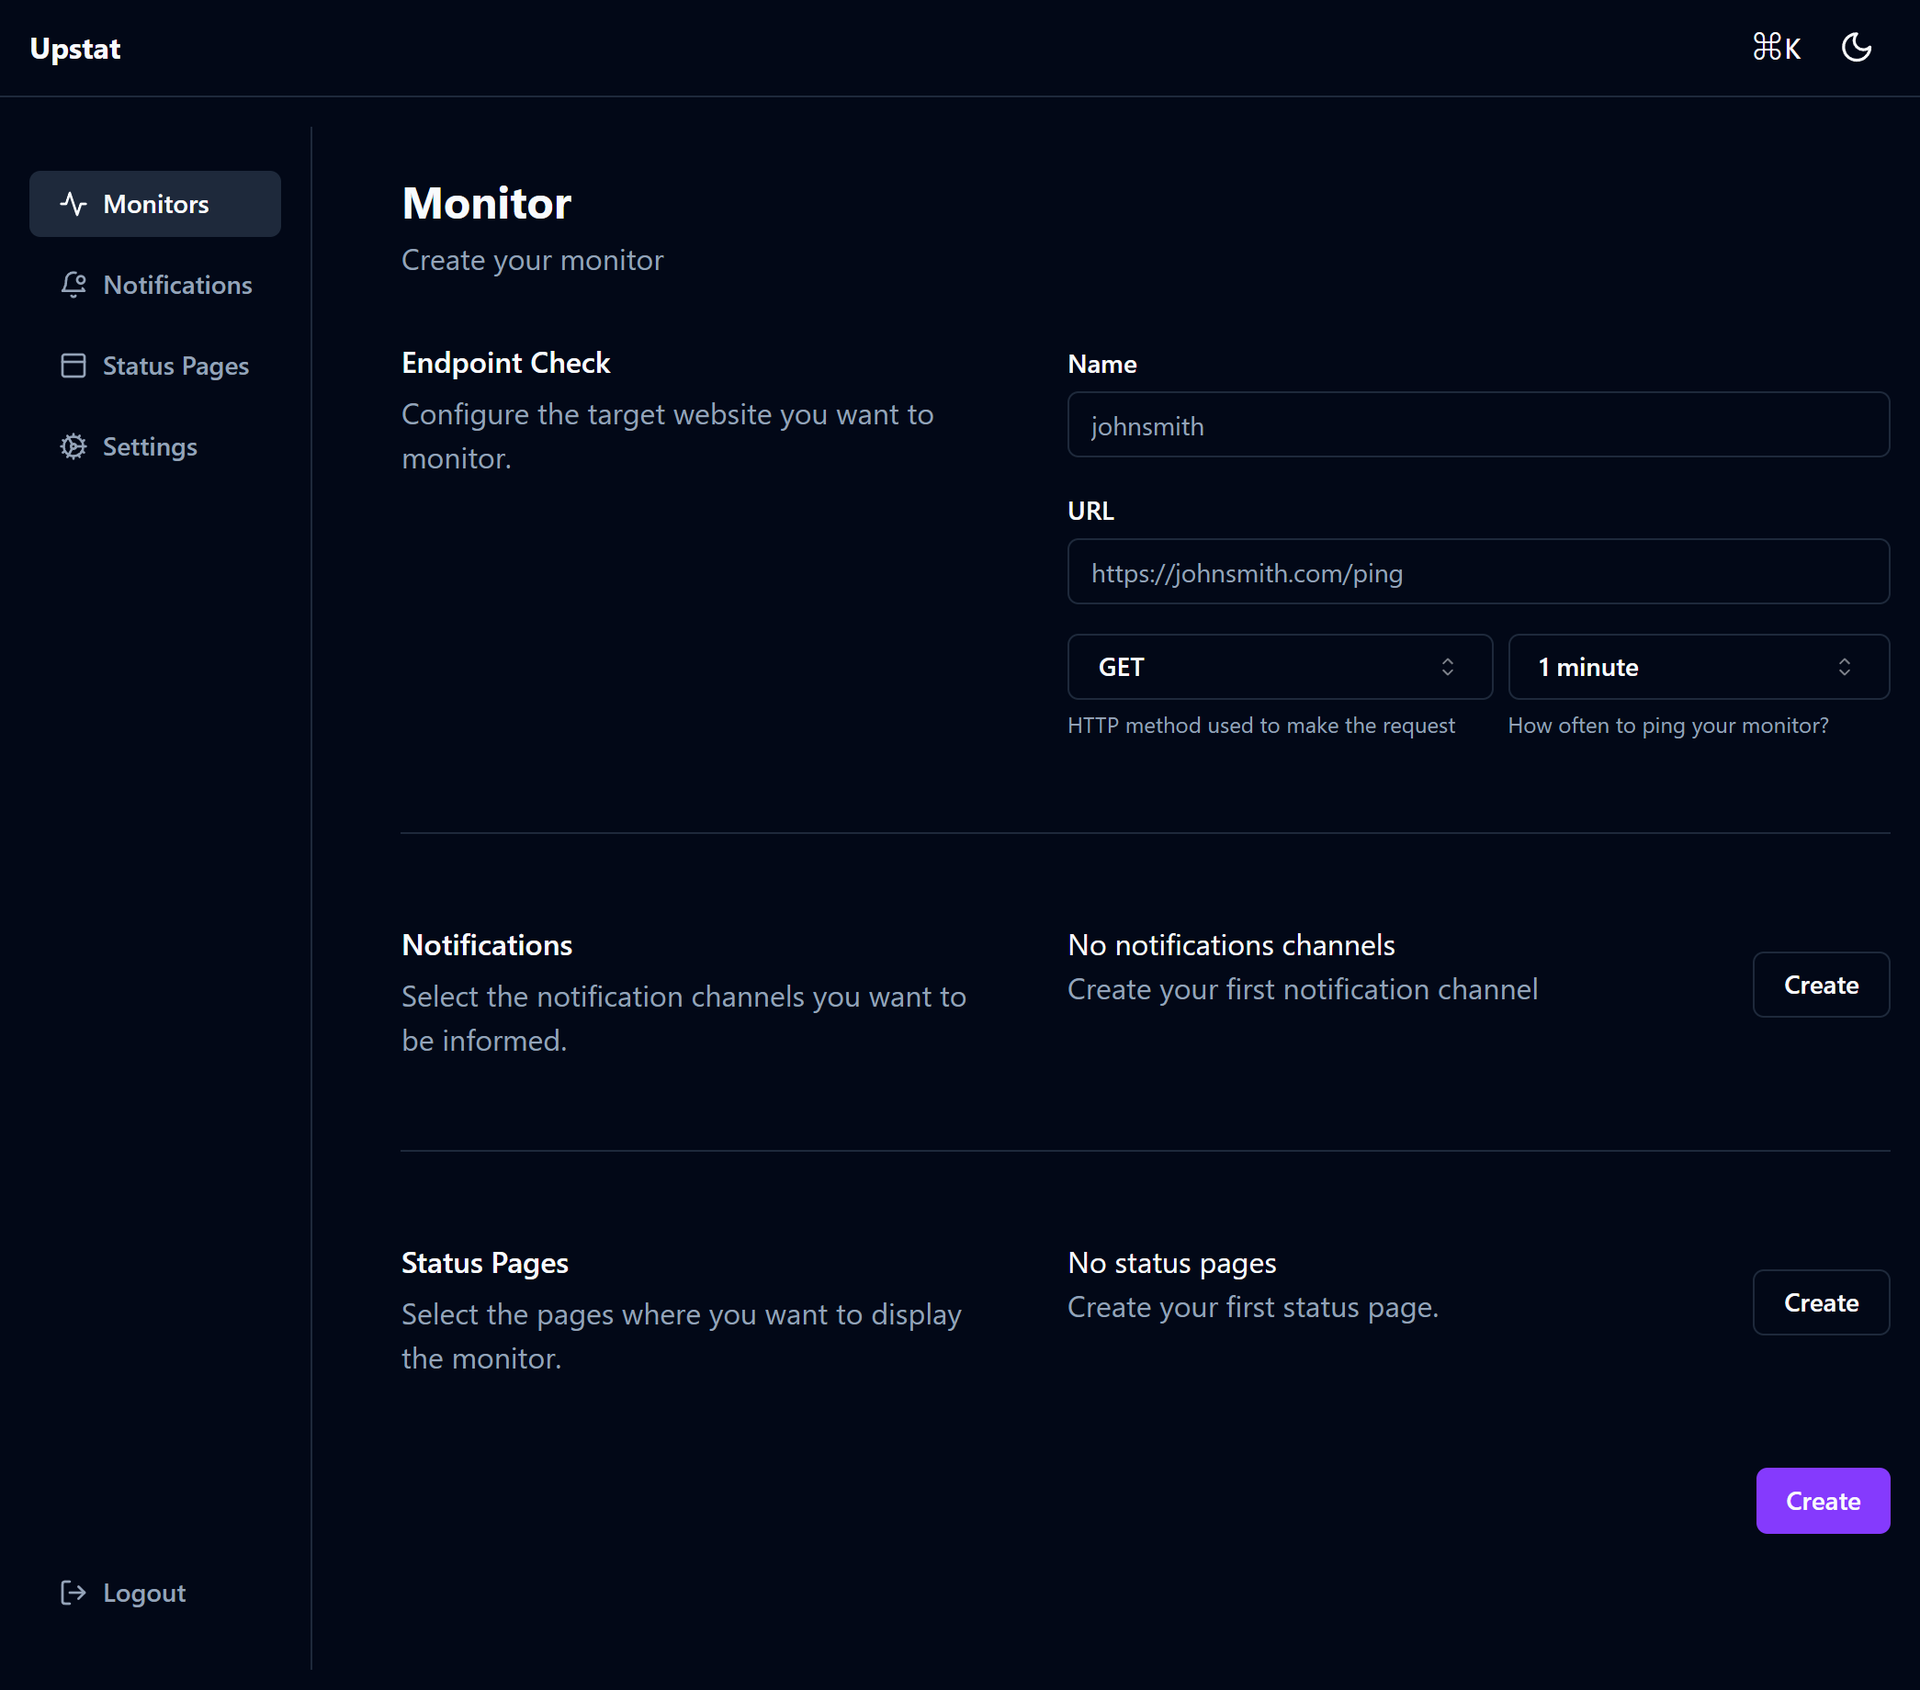
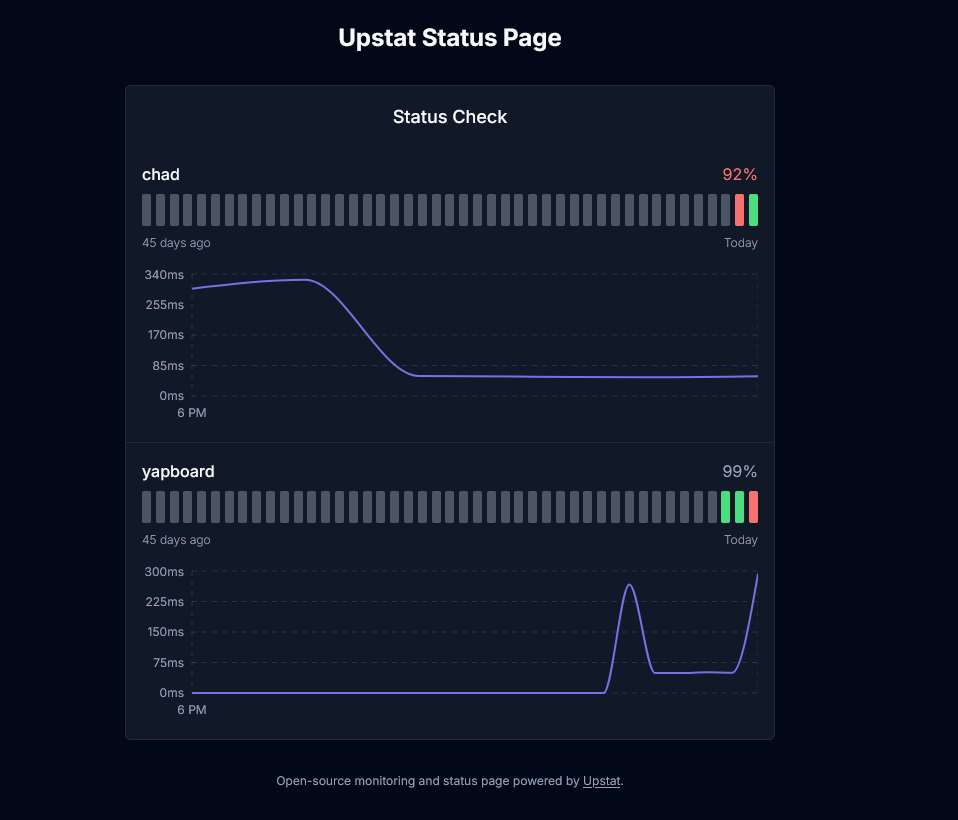
When a service you run goes down at 3 a.m., Upstat is the watcher that notices first and writes it down. Add any HTTP or HTTPS endpoint and it checks in every sixty seconds, building a living record of uptime, response latency, and ping times that you can read at a glance from status and latency charts. Certificate details sit alongside each monitor, so an expiring TLS certificate stops being a surprise outage waiting for a date. Each monitor can appear on public status pages, and you can run several of them, mapping different pages to different domains so customers, clients, or separate products each get their own honest view of what is up. When a check fails, a Discord notification heads to your channel with the news, and the dashboard keeps the incident in its history instead of letting it vanish into a chat scrollback. Install it as a progressive web app, keep its data in SQLite for a one-file setup or PostgreSQL when the deployment grows, and the whole thing stays on infrastructure you control. Running on a dedicated VPS on RepoCloud with guaranteed CPU, RAM, and SSD, full root SSH access, and a browser serial console. MIT licensed.
Benefits
- Outages Noticed In Sixty Seconds
- Every monitor is checked once a minute, so a dead endpoint surfaces almost immediately in the dashboard and in Discord instead of waiting for a user to report it.
- Status Pages For Every Audience
- Publish multiple public status pages and map each one to its own domain, giving separate products, clients, or teams an accurate page that only shows their services.
- Latency History, Not Just Uptime
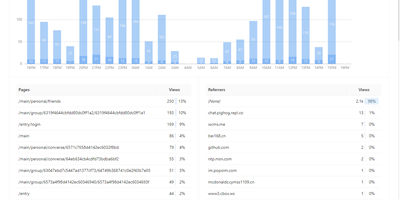
- Status, latency, and ping charts keep a continuous record of how each service behaved, making slowdowns visible long before they turn into full outages worth paging about.
- One File Or A Real Database
- Run Upstat on SQLite for a deployment that fits in a single file, or point it at PostgreSQL when a larger installation needs a shared production database.
Features
- HTTP And HTTPS Monitoring
- Monitors probe HTTP and HTTPS endpoints on a fixed sixty-second interval, recording each result so uptime percentages come from real checks, not guesses.
- Status And Latency Charts
- Per-monitor charts plot status changes alongside latency and ping history, letting you correlate a slow afternoon with the exact hour it began.
- Discord Notifications
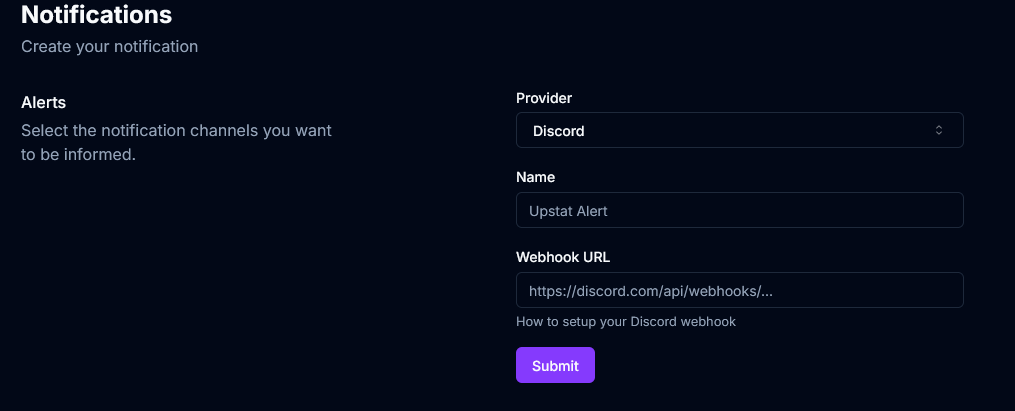
- Failed and recovered checks post notifications to a Discord channel, with monitor assertions visible so the alert carries the reason, not just an alarm.
- Certificate Information
- Each HTTPS monitor shows its TLS certificate details, so expiry dates and issuer changes are visible before a lapsed certificate takes a service offline.
- Multiple Status Pages
- Build several public status pages from your monitors and map each page to a specific domain, keeping different audiences on separate, accurate pages.
- SQLite Or PostgreSQL Storage
- Choose SQLite through the provided Docker Compose file for the smallest footprint, or PostgreSQL for a multi-user production deployment with shared storage.