Tracely
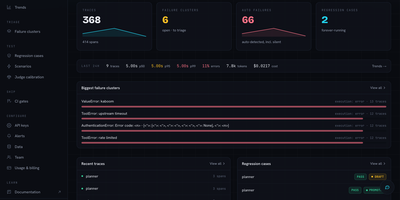
When an AI agent breaks in production, Tracely freezes that exact run into a replayable regression test and blocks the pull request that would ship the bug again. Span soup hides the failure. OTLP/HTTP traces group into conversation threads, and a waterfall marks the failing span in red with its input and output. Nobody knows if an answer was good. Evaluators sit as columns on the trace table, mixing model-free checks with LLM judges at conversation, run, or span level. Thirty-one broken runs, one issue. Clustering turns them into a single counted issue and can suggest the evaluator that would have caught it. A fix nobody can prove. One click promotes a failing trace into a hermetic case with recorded fixtures and a fail-to-pass contract, and scenarios send a red-team model after an adversarial goal. Model bills on every CI run. The suite replays offline with no API keys and no model spend, and tracely gate posts a commit status, comments on the pull request, and blocks regressions. No warning when it breaks again. Alert flows drawn on a canvas react to failed gates, broken conversations, unseen failure modes, or rising failure rates by messaging Slack, sending email, calling a webhook, or prompting an LLM. Coding agents can read traces and write evaluators through an MCP endpoint. Running on a dedicated VPS on RepoCloud with guaranteed CPU, RAM, and SSD, full root SSH access, and a browser serial console. MIT licensed.
Uptrace
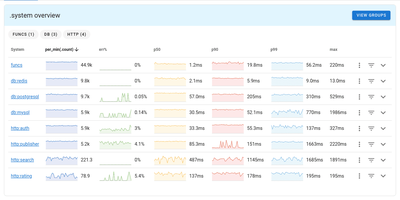
Pinpoint distributed system bottlenecks across polyglot microservices using Uptrace, an open telemetry monitoring platform that correlates traces, metrics, and logs inside a unified diagnostic dashboard. Engineers can track end-to-end request flows across polyglot microservices, inspecting database queries, third-party API calls, and internal function calls with sub-millisecond precision. The platform automatically aggregates spans into high-level latency percentiles, highlighting p50, p90, and p99 bottlenecks while calculating baseline error rates across production deployments. Integrated log correlation links log entries directly to parent trace spans, eliminating the friction of manual search across separate monitoring tools during active outages. You can construct custom dashboard views using a visual query builder, monitor cluster nodes, and map out upstream and downstream service dependencies with interactive topological graphs. Automated alerting channels notify on-call teams via Slack, Telegram, webhooks, or email whenever error budgets or metric thresholds trigger an incident. Running on a dedicated VPS on RepoCloud with guaranteed CPU, RAM, and SSD, full root SSH access, and a browser serial console. AGPL-3.0 licensed.