Kuvasz
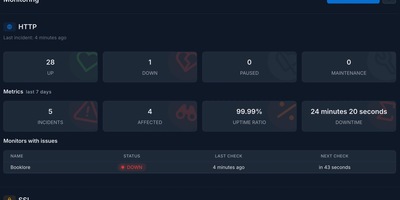
Continuous infrastructure monitoring meets automated SSL expiration tracking in Kuvasz, a self-hosted uptime platform that alerts DevOps teams before outages disrupt production operations. Operators can configure granular health checks across HTTP endpoints, ICMP ping targets, and raw TCP ports with custom polling intervals down to seconds. Automated SSL inspectors track certificate validity, issuing early warning notices before cryptographic chains expire and disrupt production traffic. A push monitoring system receives incoming heartbeat signals from background cron jobs, database backups, and recurring automation scripts, triggering alerts whenever expected pings fail to arrive on schedule. Multi-channel dispatchers route incident notifications through Slack, Discord, Telegram, Microsoft Teams, PagerDuty, and custom webhook payloads with adjustable failure count thresholds to eliminate transient false alarms. Maintenance windows let teams schedule planned downtime through one-off intervals or recurring cron expressions, automatically muting notifications during deployment cycles. Public and private status pages publish categorized system health metrics, historical latency charts, and incident timelines to keep internal stakeholders and end users informed. An integrated Model Context Protocol server allows AI assistants to query monitoring states and toggle checks directly via conversational interfaces. Running on a dedicated VPS on RepoCloud with guaranteed CPU, RAM, and SSD, full root SSH access, and a browser serial console. AGPL-3.0 licensed.
Peekaping
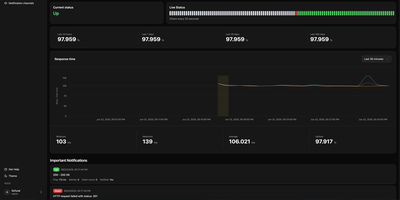
Keep users ahead of outages by consolidating infrastructure monitoring into Peekaping, a unified uptime monitoring and incident communication platform that alerts engineering teams to network and application failures before customers experience disruptions. Users can configure automated synthetic checks across HTTP endpoints, database engines, message queues, and container runtimes to verify response latency, payload integrity, and SSL certificate expiration. When performance thresholds degrade or connections drop, the platform broadcasts structured incident notices across twenty-two notification channels including Slack, Discord, Telegram, PagerDuty, and custom webhooks. Visual dashboards display live heartbeat timelines, historical latency percentiles, and rolling availability scores for each monitored endpoint. System administrators can assemble custom public status pages with custom domains, branded color schemes, and component grouping to inform external stakeholders during planned maintenance or unforeseen service degradations. Teams can schedule recurring maintenance windows to pause alert notifications during routine deployments and generate API tokens to automate monitor creation directly from CI/CD deployment pipelines. Running on a dedicated VPS on RepoCloud with guaranteed CPU, RAM, and SSD, full root SSH access, and a browser serial console. MIT licensed.