Alerta
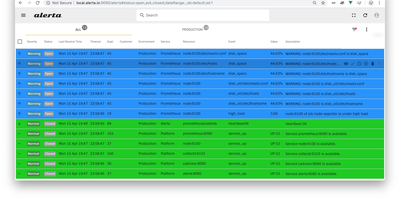
Five monitoring systems should not mean five places to look when something breaks at 3 a.m. Alerta is an open-source alert management server that consolidates alerts from many sources into a single stream, de-duplicates repeats, correlates severity changes, and shows only the current state of each problem in a web console built for fast scanning. Prometheus, Zabbix, Nagios, InfluxDB Kapacitor, cloud watch alarms, and your own scripts all post into the same HTTP API, which accepts a flexible alert format carrying environment, resource, event, severity, and custom attributes, so no tool has to contort itself into someone else's schema first. Repeats of a known fault raise a duplicate count instead of generating another page, and a severity change updates the existing alert rather than birthing a twin. Operators acknowledge problems, assign them, silence expected fire during blackout periods set for maintenance windows, and partition visibility by customer for teams that monitor other people's infrastructure. A command-line client, query language, webhooks, and plugin hooks carry alerts onward into tickets, chat, and paging workflows, and everything persists in MongoDB or PostgreSQL with API keys and OAuth protecting access. Running on a dedicated VPS on RepoCloud with guaranteed CPU, RAM, and SSD, full root SSH access, and a browser serial console. Apache-2.0 licensed.
Grafana OnCall
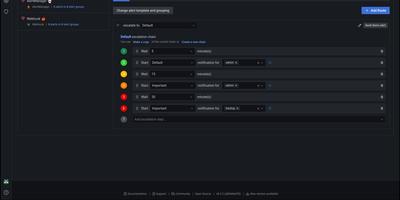
With 3,900 GitHub stars, 140 contributors, and 380 releases since its 2022 launch, Grafana OnCall delivers developer-friendly incident response that routes alerts from any monitoring system to the right engineer at the right time through the right channel. The platform accepts alerts via unique API URLs from Alertmanager, Grafana Alerting, Zabbix, Datadog, Pagerduty-compatible sources, Jira, inbound email, and generic HTTP webhooks, then applies routing templates to direct each alert to the appropriate escalation chain. Escalation chains define notification sequences — notify the primary on-call via Slack, wait 5 minutes, escalate to SMS and phone, wait 10 minutes, page the secondary on-call and notify the engineering manager — continuing until acknowledgment or resolution. On-call schedules support multi-layer rotations with overrides, shift swaps, and timezone-aware handoffs rendered directly inside Grafana dashboards. ChatOps integration publishes alert groups to Slack channels and Telegram groups with interactive buttons for acknowledge, resolve, and silence actions. Template engines based on Jinja2 control alert grouping, appearance rendering, and behavioral automation. The REST API enables programmatic management of integrations, schedules, and escalation policies. Deploy via Docker Compose with PostgreSQL, Redis, and Celery workers alongside your existing Grafana instance. Running on a dedicated VPS on RepoCloud with guaranteed CPU, RAM, and SSD, full root SSH access, and a browser serial console. GNU AGPL v3 licensed.