OpenReplay
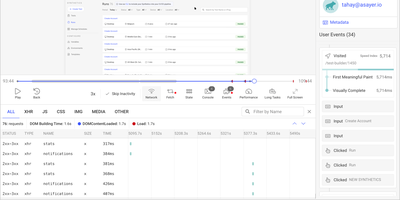
Backed by 12,400+ GitHub stars and positioned as the self-hosted alternative to FullStory and Hotjar, OpenReplay delivers the open-source session replay platform that keeps every byte of user behavior data on your own infrastructure. The JavaScript tracker captures pixel-perfect recordings of clicks, scrolls, form inputs, and navigation with automatic sensitive data masking, while simultaneously logging network requests, console errors, JavaScript exceptions, and Redux, VueX, MobX, NgRx, Pinia, and Zustand store state changes for complete technical context. DevTools mode reconstructs each session with full stack traces, GraphQL queries from Apollo and Relay, Fetch and Axios request payloads, CPU and memory metrics, and page speed waterfall charts — effectively giving developers a browser inspector tied to any user session. Product analytics surfaces conversion funnels, user journeys, click heatmaps, web vitals trends, and retention cohorts without requiring custom instrumentation. Co-browsing connects support agents to live user sessions with cursor control and WebRTC audio, enabling real-time assistance without third-party screen-sharing software. Integrations push session context into Sentry, Datadog, CloudWatch, Stackdriver, and Elastic for front-to-back debugging. Feature flags enable gradual rollouts with session-level targeting. The platform deploys to any cloud via Docker and Kubernetes with auto-scaling ingestion handling up to 50,000 sessions per month on the open-source edition. Running on a dedicated VPS on RepoCloud with guaranteed CPU, RAM, and SSD, full root SSH access, and a browser serial console. AGPLv3 licensed.
Highlight
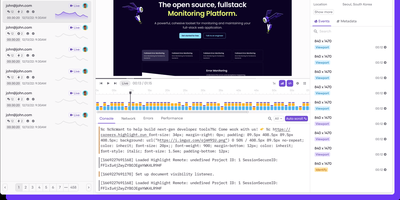
With over 9,000 GitHub stars and a focus on developer experience over legacy monitoring complexity, Highlight.io delivers a unified observability platform that correlates frontend user behavior with backend performance data in a single interface. The session replay engine captures high-fidelity DOM recordings showing exactly what users experienced, including console logs, network requests, page transitions, and user interactions, with configurable privacy redaction for sensitive content. Error monitoring automatically groups and deduplicates errors, surfaces affected user sessions, and provides full stack traces with source map support for minified production code. The logging pipeline ingests structured and unstructured logs from any backend service with automatic property extraction, full-text search, and configurable alerting thresholds. Distributed tracing tracks request flows across microservices with embedded links to associated sessions, errors, and logs for complete request lifecycle visibility. The metrics system collects custom application metrics alongside built-in web vitals and performance data for trend analysis and anomaly detection. Search across all telemetry types uses a unified query language with automatic attribute discovery and saved views for recurring investigations. Integrations connect with Slack, Discord, Linear, Jira, Vercel, and dozens of other developer tools for notification routing and workflow automation. SDKs cover React, Next.js, Vue, Angular, Python, Go, Ruby, Java, PHP, and Elixir with framework-specific instrumentation. Self-hosted deployment runs via Docker Compose with ClickHouse for analytics storage. Running on a dedicated VPS on RepoCloud with guaranteed CPU, RAM, and SSD, full root SSH access, and a browser serial console. Apache 2.0 licensed.