Apache IoTDB
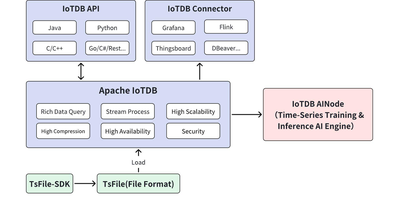
Sensors on factory floors, wind turbines, and connected vehicles produce readings every second, and Apache IoTDB is the time-series database built to store those readings and answer questions over them. Devices write through client sessions that tolerate out-of-order, delayed, and multi-frequency arrivals, so a gateway that reconnects after an outage can backfill history without corrupting the timeline. Series live in a device hierarchy you can browse like a directory tree, or in tables queried with standard SQL, common table expressions, set operations, and more than one hundred built-in aggregation and time-series functions. The TsFile columnar format shares one time column across aligned series and applies encodings designed for sensor data, which keeps high-frequency archives compact while Spark and Hadoop jobs read the same files directly for larger analysis. Pipe synchronization streams records or transfers whole TsFiles between edge sites and central clusters with path and device filtering, so plants keep collecting locally while headquarters queries a continuous copy. AINode brings forecasting, anomaly detection, and missing-value imputation into the database itself: register a model with SQL, then ask for predictions in the same query language instead of shipping measurements to a separate machine learning service. A low-memory Edge edition runs collection on constrained gateways, and clusters scale by adding DataNodes under ConfigNode coordination with automatic load balancing. Running on a dedicated VPS on RepoCloud with guaranteed CPU, RAM, and SSD, full root SSH access, and a browser serial console. Apache-2.0 licensed.
QuestDB
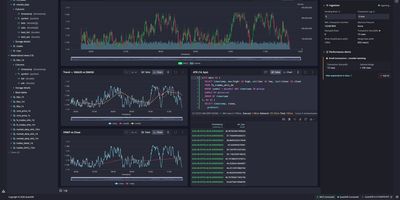
Powering trading floors at firms processing millions of market data events per second and trusted by organizations including Airbus, Yahoo, and Copenhagen Atomics, QuestDB has earned over 17,000 GitHub stars as the time-series database that refuses to make you choose between ingestion speed and query latency. The column-oriented, time-partitioned storage engine processes millions of rows per second on ingest through write-ahead logging with instant durability, while SIMD-accelerated parallel execution returns analytical queries over billions of rows in milliseconds. Time-series SQL extensions add ASOF JOIN for point-in-time lookups across tables with misaligned timestamps, SAMPLE BY for downsampling at arbitrary time intervals, LATEST ON for last-value queries, and WINDOW JOIN for sliding window aggregations — all through standard SQL syntax accessible via the PostgreSQL wire protocol, REST API, or the QuestDB Wire Protocol (QWP) that streams Apache Arrow at 220 million rows per second. Multi-tier storage automatically moves data from the WAL through native columnar format to Parquet files on S3-compatible object storage, keeping hot data fast and cold data portable without manual tiering. The built-in web console provides an interactive SQL editor with syntax highlighting, autocomplete, and charting for quick data exploration. Views, materialized views, and n-dimensional arrays support real-time analytics, while native Parquet export enables direct integration with Python, DuckDB, and AI/ML frameworks. Running on a dedicated VPS on RepoCloud with guaranteed CPU, RAM, and SSD, full root SSH access, and a browser serial console. Apache 2.0 licensed.
VictoriaMetrics
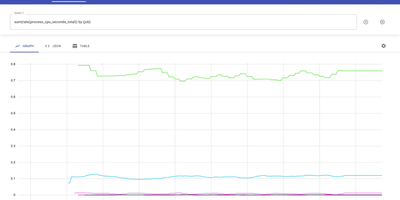
Trusted by thousands of organizations processing billions of time series data points and backed by 17,000+ GitHub stars, VictoriaMetrics delivers a monitoring and time series database that outperforms Prometheus by 16x on query speed while consuming 2.5x less disk space through its optimized compression and storage engine. The architecture supports both single-node deployments handling 10M+ active time series and a horizontally scalable cluster version with vminsert, vmstorage, and vmselect components providing multi-tenancy, replication, and independent namespace isolation. Data ingestion accepts both push protocols including InfluxDB line protocol, Graphite plaintext, OpenTSDB HTTP, CSV, and OpenTelemetry OTLP alongside pull-based Prometheus scraping and remote write, enabling drop-in replacement of existing monitoring stacks without reconfiguring exporters. MetricsQL extends standard PromQL with additional functions, subqueries, and implicit time range alignment while maintaining full backward compatibility with existing Prometheus alerts and Grafana dashboards. The vmalert component processes recording and alerting rules with Alertmanager integration, while vmbackup and vmrestore enable point-in-time snapshots to S3, GCS, and Azure Blob Storage. Stream aggregation operates as a StatsD alternative for pre-aggregating high-cardinality metrics before storage. NFS-compatible storage backends including Amazon EFS and Google Filestore allow shared persistent volumes across cluster nodes. Running on a dedicated VPS on RepoCloud with guaranteed CPU, RAM, and SSD, full root SSH access, and a browser serial console. Apache-2.0 licensed.