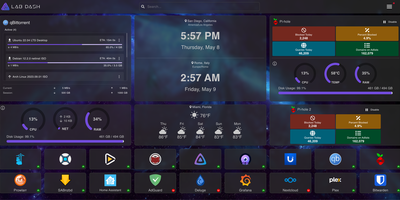
Lab Dash
Every homelab deserves a control center that looks as good as the services it manages. Lab Dash gives you a customizable, drag-and-drop dashboard where every tile earns its spot. Add shortcut widgets linking to your Plex, Grafana, Nextcloud, or any service with automatic health check indicators showing green or red status at a glance. The system monitoring widget displays real-time CPU usage, memory consumption, network throughput, disk utilization, and temperature readings by mounting the host /sys directory as a read-only volume. Integrate Pi-hole stats, qBittorrent download progress, and media server widgets for Jellyfin, Plex, or Emby directly on your grid. Multiple pages let you organize services by category, and the search bar finds any tile instantly. Customize the background image from a local upload or URL, set a custom title and tab name, and choose your preferred search provider including self-hosted options like SearXNG. All sensitive configuration data is encrypted locally with AES-256-CBC, and only administrator accounts can modify the layout. Install Lab Dash as a Progressive Web App on desktop, phone, or tablet for a native app experience with offline capability. Configurations export as backup files for easy migration between instances. On RepoCloud, deploy Lab Dash on a dedicated VPS with root SSH access and Docker socket connectivity under the GPL-3.0 license.
Deploy